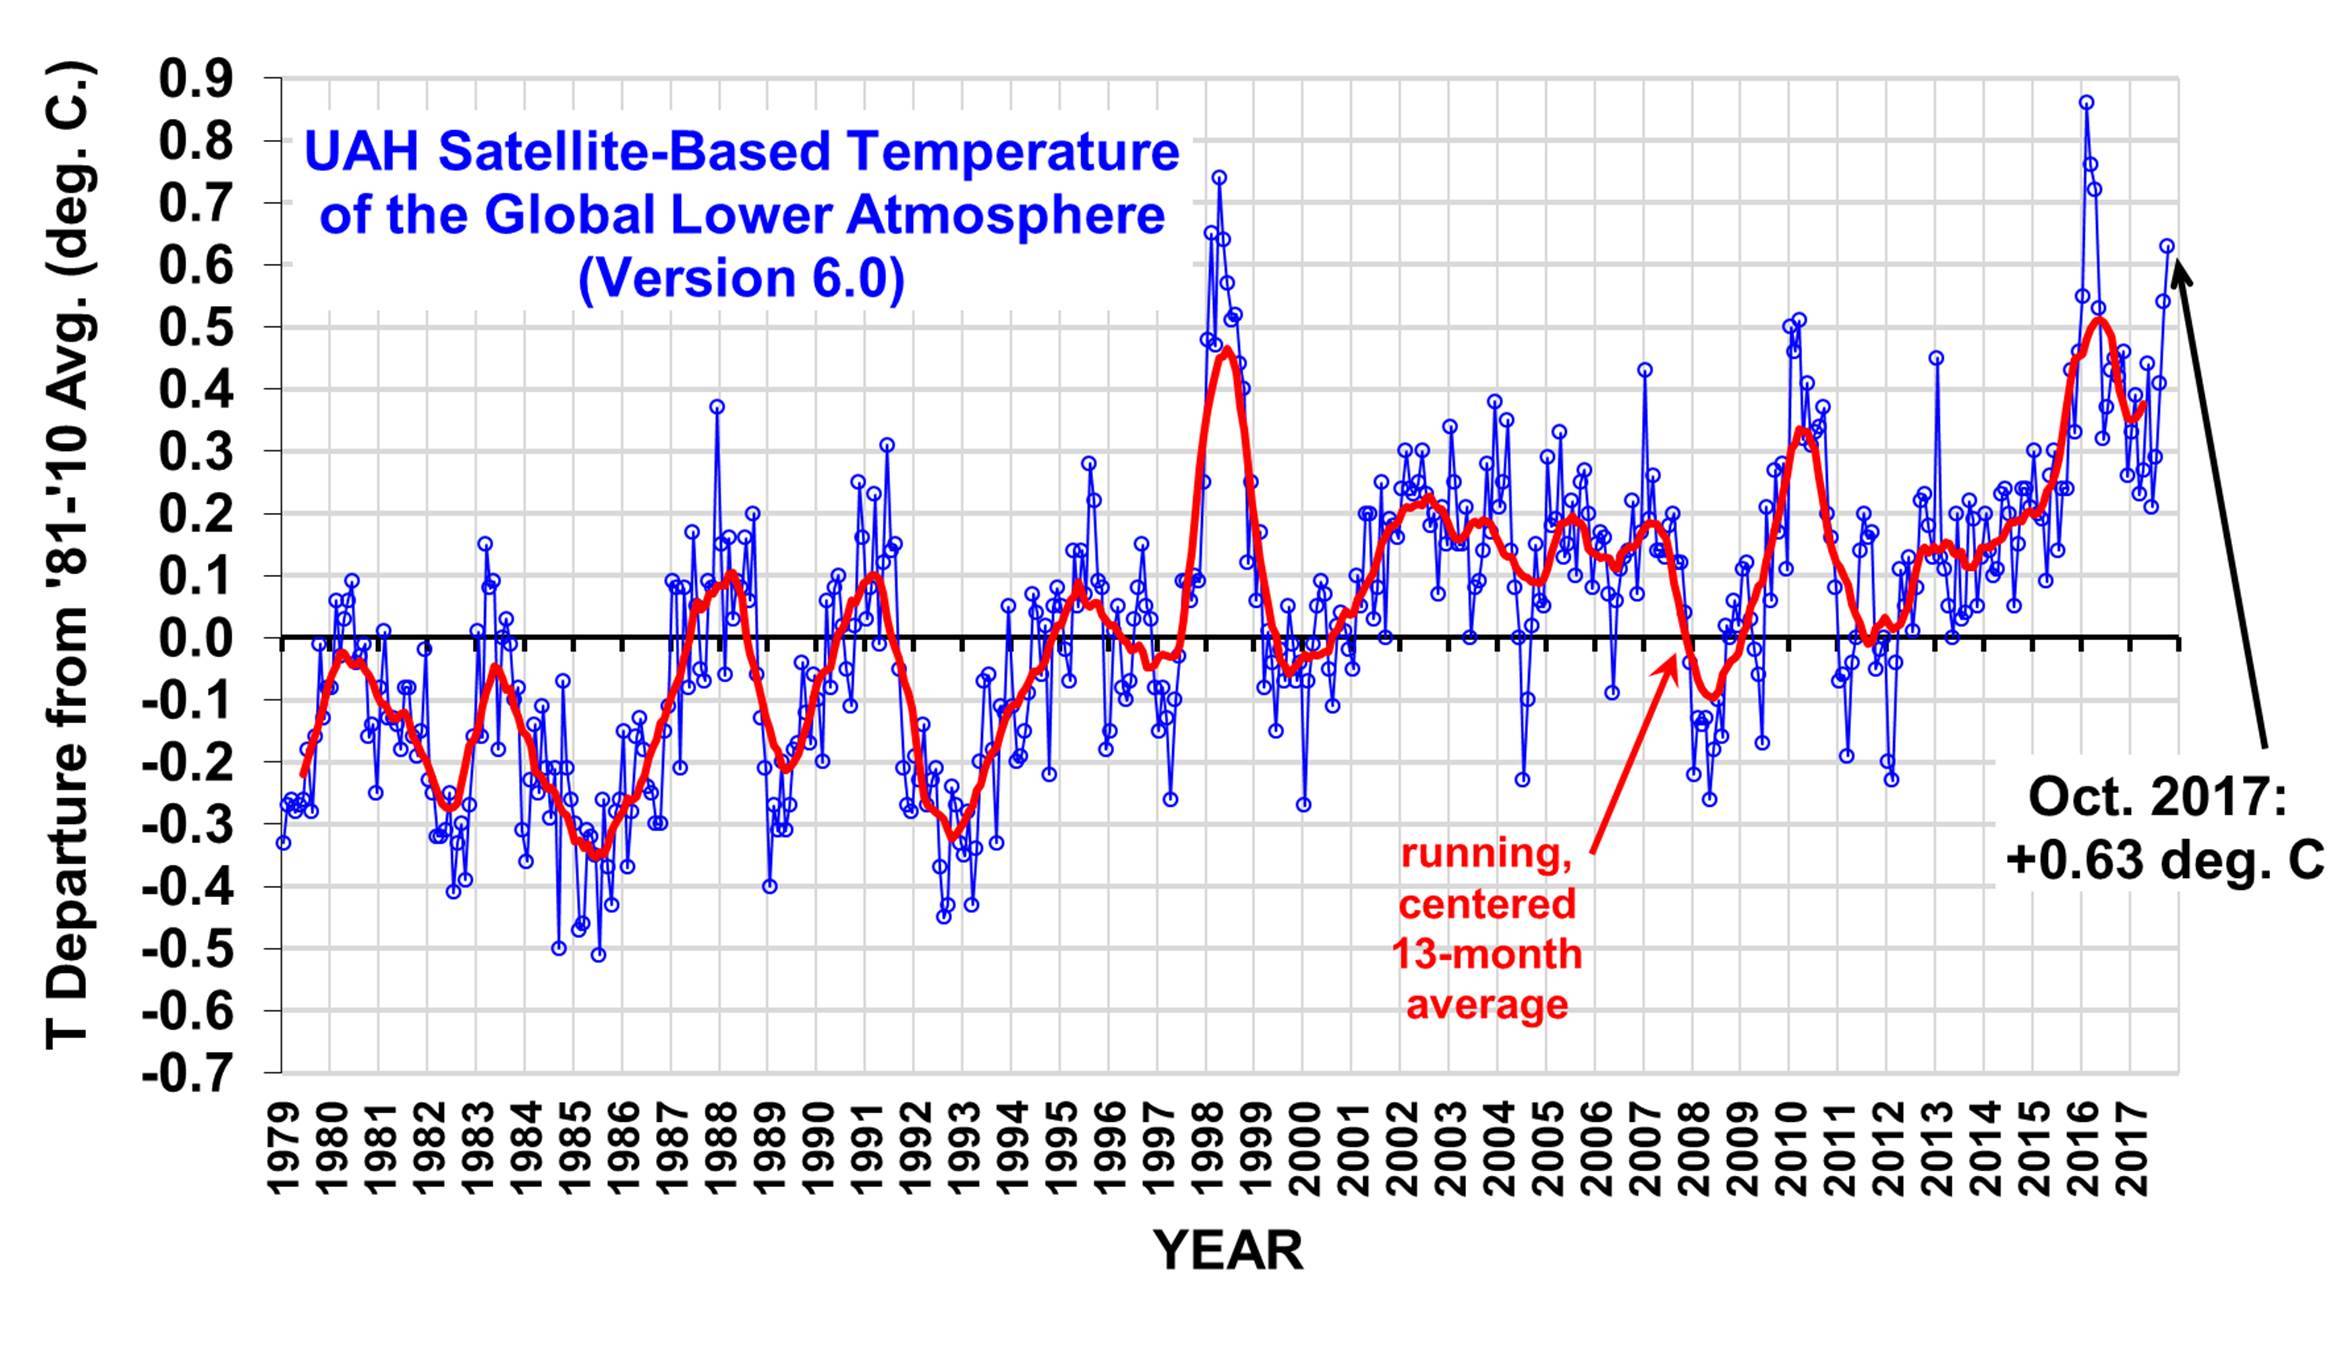
No temperature increase, but the glaciers worldwide are in rapid retreat and thinning? LOL
All of the models predicted that the Karakoram glaciers would retreat......but they haven't. Other glaciers at latitudes further south have expanded as well.( conveniently ignored by the global warming alarmist community )
Some Of The World’s Largest Non-Polar Glaciers Are Expanding, Despite Global Warming
Again.........when you read the article, you realize that the computer models have zero reliability at predicting the future for any climate scenario.
Nov 27, 2015 • Capitalizing on the long Landsat data record and the human brain’s capacity to recognize movement, Frank Paul from the University of Zurich has created glacier animations that enable viewers to witness the complex flow of glaciers.
Animating the “Karakoram Anomaly” with Landsat « Landsat Science
Measuring glacier movement—famed for its glacial pace—is often done with GPS ground measurements or image-based feature tracking (e.g. the movement of surface debris). While these measurements are reliable, visually demonstrating this gradual movement using static images can be challenging given the brain’s limited ability to discern change between two static images.
Paul’s paper, published on Nov. 26 in The Cryosphere, focuses on a set of four regions with numerous glaciers in the central Karakoram mountain range, a steep rouged landscape of high terrain (> 7000 m or ~23,000 feet in some places) and home to behemoths such as K2.
In this region, unlike most other global locations, several glaciers are rapidly advancing. But these are surging glaciers whose normal flow rate is interspersed with periods when velocities increase by as much as three orders of magnitude. The accreting behavior of the region’s glaciers has been labeled the “Karakoram Anomaly.”
Paul’s animations allow Karakoram glacier flow patterns to come alive for viewers. Both the regular flow of non-surging glaciers and the peculiar flow patterns of surging glaciers can be witnessed. In this complex interaction, supra-glacial lakes appear and disappear, terminuses advance, rivers of ice coalesce then separate post-surge, and all the while glacial debris seems to dance and swirl.
The animations were created for everyone interested in seeing how dynamic and complex the interactions between glaciers can be, especially in the understudied Karakoram region, Paul explained.
Surging glaciers. Measure them at the beginning of the surge, or after the meltback after the surge, and they are retreating, measure them at the height of the surge, and they are expanding.
http://dailycaller.com/2017/08/11/s...laciers-are-expanding-despite-global-warming/
Some of the largest non-polar glaciers in the world are either stable or growing due to a “vortex” of cold air over a 1,200-mile section of the greater Himalayan mountain range in central Asia, according to a new study.
Climate models haven’t been able to reproduce the phenomenon, which is keeping Karakoram mountain range glaciers from melting like most of the world’s other glaciers, the
study found.
“While most glaciers are retreating as a result of global warming, the glaciers of the Karakoram range in South Asia are stable or even growing,” Hayley Fowler, the study’s co-author and professor at Newcastle University, said in a
statement.
Karakoram is one of the most heavily-glaciated areas of the world outside the poles, and boasts the world’s second- and third-largest non-polar glaciers. It’s also home to the world’s second-largest peak, K2 —
Yes, as the article you posted clearly says, most of the world's glaciers are retreating and thinning. A few, because of localized conditions, are expanding, or at least expanding within a limited time frame. Compared to the amount of ice the rest of the glaciers in the world, and, indeed, within the Himalayas, melting, the amount of water involved in the expansion of those particular glaciers, is minute compared to the amount of melt.
 . You might say, the Grinch has stolen all the festive cheer!! These mofu's are going to be miserable.