abu afak
ALLAH SNACKBAR!
- Mar 3, 2006
- 7,963
- 2,768
- 315
LOL
Nothing goes straight up in nature
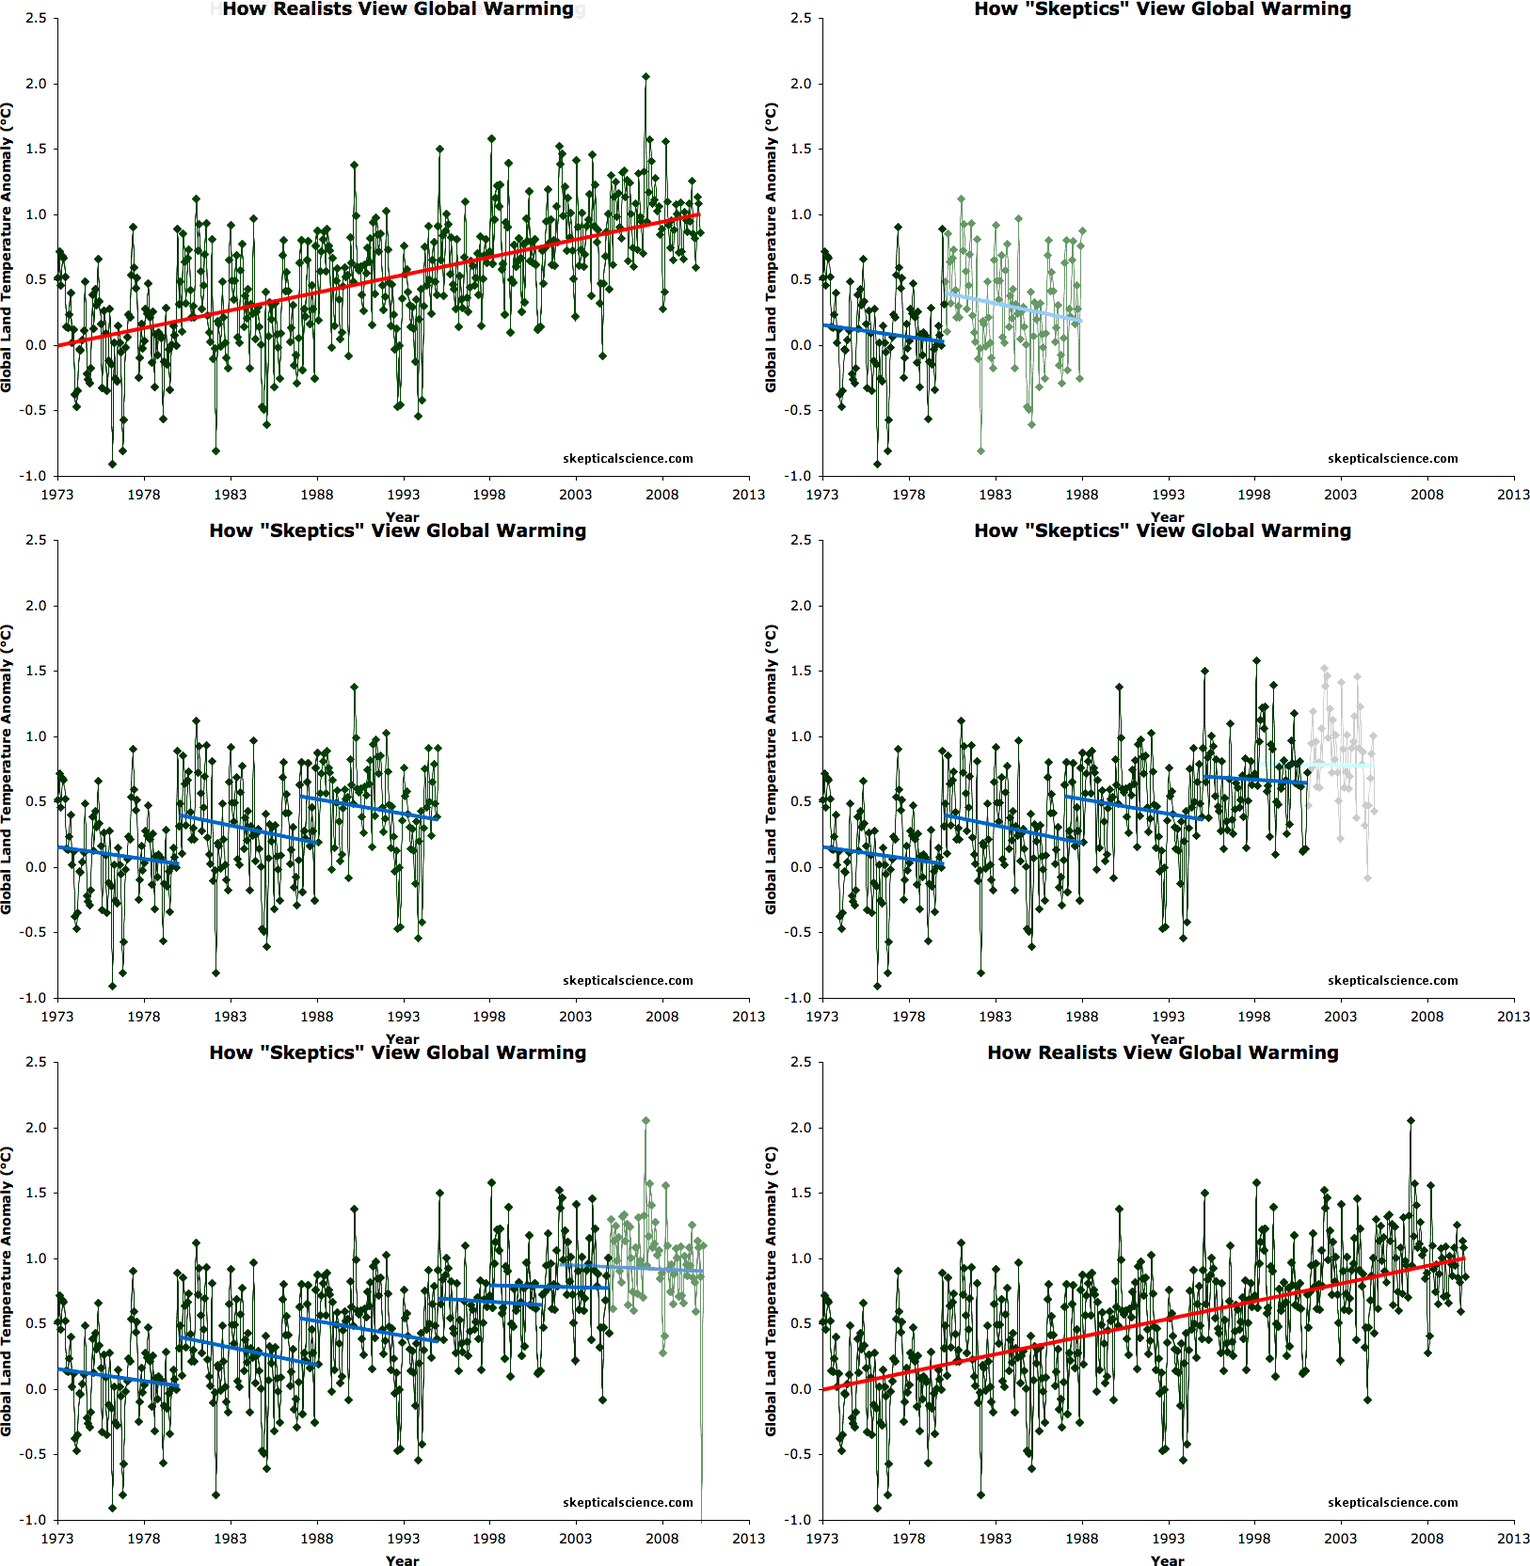
So if you pick every SPIKE Year on the LONGER UPTREND and draw a line for 5-10 yr after you will see flat-to-down Steps on the UP staircase.
Look at all those 5-10 year "NO warming periods"!
Look at all this "Cooling": and they were more Records Since the Graph ended in 2013. (the one you now point to 2016-2022.
2016 was a NEW High with 2020 close, that was the "Cooling," but in fact just another STEP on the IP LADDER.

`
Nothing goes straight up in nature
So if you pick every SPIKE Year on the LONGER UPTREND and draw a line for 5-10 yr after you will see flat-to-down Steps on the UP staircase.
Look at all those 5-10 year "NO warming periods"!
Look at all this "Cooling": and they were more Records Since the Graph ended in 2013. (the one you now point to 2016-2022.
2016 was a NEW High with 2020 close, that was the "Cooling," but in fact just another STEP on the IP LADDER.

`
Last edited:

