Freewill
Platinum Member
- Oct 26, 2011
- 31,158
- 5,088
- 1,130
I guess if you like it cold this is good news. Personally I like it a bit warmer.
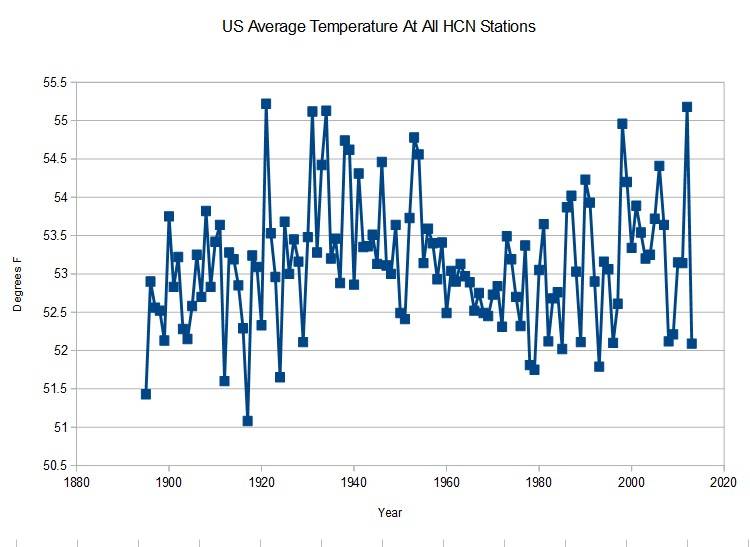
2013 Will Finish One Of The Ten Coldest Years In US History, With The Largest Drop In Temperature
The top seven global warming alarmist setbacks in 2013
Read more: Seven global warming alarmist setbacks in 2013 | The Daily Caller
2013 Will Finish One Of The Ten Coldest Years In US History, With The Largest Drop In Temperature
The top seven global warming alarmist setbacks in 2013
Read more: Seven global warming alarmist setbacks in 2013 | The Daily Caller