
- Sep 16, 2012
- 58,075
- 51,662
- 3,605
. . . interestingly enough, if you watch that whole video, Moyers did a segment on the TPP. Did you note how when both the left AND the right decried that Deep State's agenda on that. . . it died? 
Follow along with the video below to see how to install our site as a web app on your home screen.

Note: This feature currently requires accessing the site using the built-in Safari browser.
That’s weird...I take great pride in schooling ignorant LefTard fools.Not to worry - Schooling ill-informed RW Kooks is what I do best!")
And these women decided they didn't need a man. Looks like they made the wrong choice.Welfare demographics
- 56 percent of all people living in poverty in 2018 were women. [Source: United States Census Bureau for American Progress]
- More women lived in poverty in the United States than men in 2018, totaling 21.4 million. [Source: United States Census Bureau for American Progress
Having worked for the state, I have no doubt that they will grab whatever money they can get regardless of who is in office. The issue for the states will be the cost sharing formula. Will funding be block grants or will funding be based on project or will feds use the current highway funding formula.Appreciate your ability to articulate a viewpoint. But you’ve yet to articulate what was so horrible about all the truly great things our government has done.
Sorry man, as much as you hate the federal government, if you look back on American history while there have been plenty of fuckups, there has been far more great innovation and beauty.
You want a wall? Fine, start a fundraiser and build it yourself. More of us would prefer bridges that weren’t crumbling, roads that didn’t puncture perfectly good tires, water free of lead, modern electrical grids that didn’t freeze over, and airports that weren’t embarrassing.
See, it's discussions like this, when I am trying to explain to a layman about how government actually works, and they confuse my knowledge of government, with my opinion.
YOU, seem to have this idea, much like the OP, that the Federal Government would just go in and pave the roads of Route 66. This is a misconception.
The States and localities are responsible for infrastructure. The Federal Government makes plans, but due to federalism, can only make Grants, and Block Grants with strings attached in an effort to ply it's will. If the states do not choose to do what the Feds. want? They don't necessarily get the grants.
You are aware that Obama's "Common Core," failed just as miserably as this will if the vision is not laid out better. Because, in the end, it is the STATES that administer it, NOT THE FEDERAL GOVERNMENT. And this plan will meet the same end as Common Core if you keep on with your arrogance.
All of those examples you gave? They are all the business of the States and Localities, always have been, and always will be. The entire thread is. . well, one big straw-man and a lie. I laugh at it, but then, I have training in government, and I KNOW how the system works. Your fantasies are just that. . . big plans for slush funds for graft and corruption.
You can list ACTUAL Federal projects, where the Fed. has the authority, but then don't go on to list local and state areas where it has none, and tell us there is a harm which can be alleviated with Federal power, which the Constitution prohibits.
Do you think Joe and the DNC are some sort of politburo and a dictator now? Do you think our system does not apply anymore?
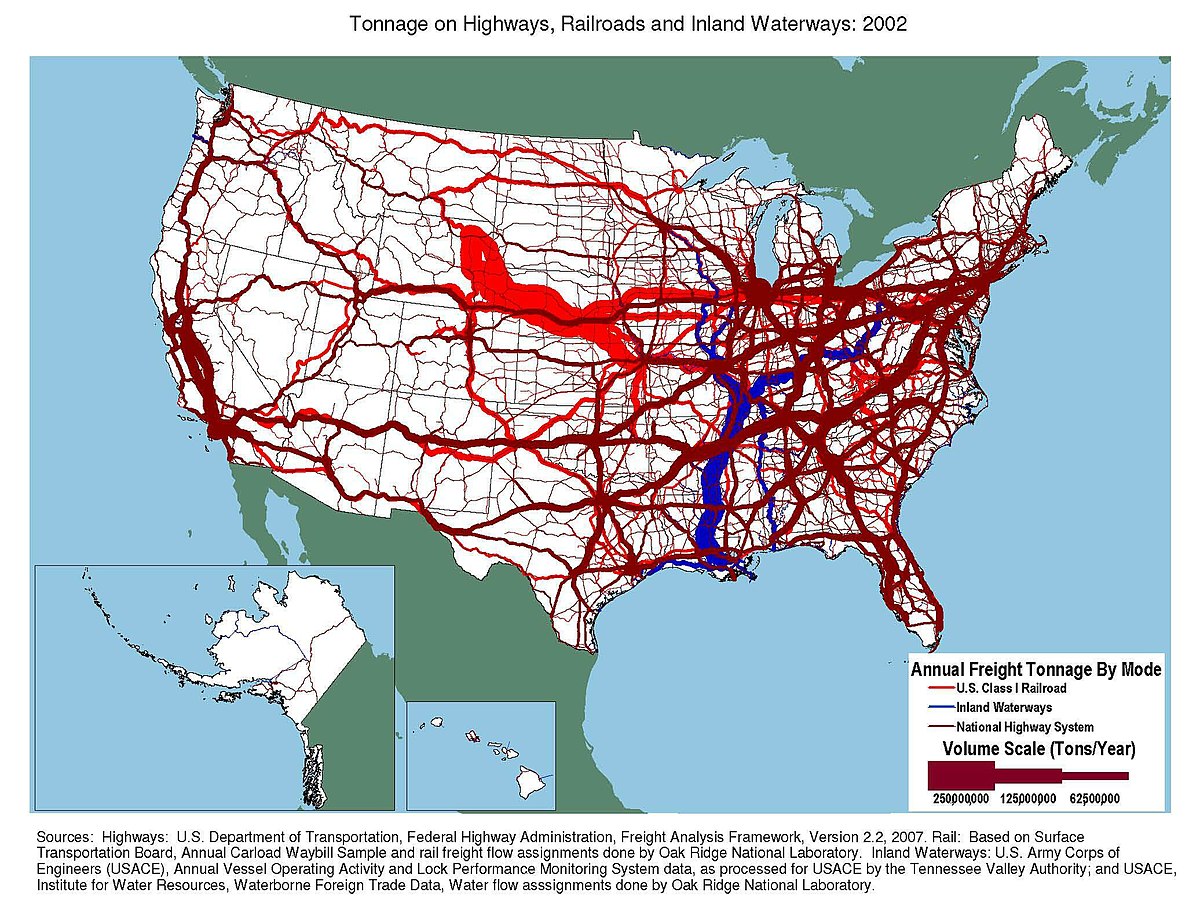
"The overwhelming majority of roads in the United States are owned and maintained by state and local governments. Federally maintained roads are generally found only on federal lands (such as national parks) and at federal facilities (like military bases). The Interstate Highway System is partly funded by the federal government but owned and maintained by individual state governments. There are a few private highways in the United States, which use tolls to pay for construction and maintenance. There are many local private roads, generally serving remote or insular residences. . . . "
Transportation in the United States - Wikipedia
en.wikipedia.org

Transportation in the United States - Wikipedia
en.wikipedia.org
Many, many, of these other programs that this administration wants to claim as "infrastructure," are the same. They are the jurisdiction of the various STATES, not the Feds. So I am just not sure, if this administration is going to have success with this program, it will have to build not only a coalition with the GOP, but with the people in the STATES.
And after the way the DNC and the corporatacracy came to office and is gas-lighting half the nation making them feel like terrorists? Yeah. . . good luck with that.
Is suppose to be surprising? Blacks have the highest level of poverty followed by Hispanics, Pacific Islanders, then Whites.That’s weird...I take great pride in schooling ignorant LefTard fools.Not to worry - Schooling ill-informed RW Kooks is what I do best!
Who Participated in Welfare?
The black population: At 41.6 percent, blacks were more likely to participate in government assistance programs in an average month.
The black participation rate was followed by Hispanics at 36.4 percent, Asians or Pacific Islanders at 17.8 percent, and non-Hispanic whites at 13.2 percent.
21.3% of US Participates in Government Assistance Programs Each Month
About 52.2 million people in the US participated in major means-tested government assistance programs each month in 2012, according to a Census Bureau report.www.census.gov
Is suppose to be surprising? Blacks have the highest level of poverty followed by Hispanics, Pacific Islanders, then Whites.That’s weird...I take great pride in schooling ignorant LefTard fools.Not to worry - Schooling ill-informed RW Kooks is what I do best!
Who Participated in Welfare?
The black population: At 41.6 percent, blacks were more likely to participate in government assistance programs in an average month.
The black participation rate was followed by Hispanics at 36.4 percent, Asians or Pacific Islanders at 17.8 percent, and non-Hispanic whites at 13.2 percent.
21.3% of US Participates in Government Assistance Programs Each Month
About 52.2 million people in the US participated in major means-tested government assistance programs each month in 2012, according to a Census Bureau report.
LOL..Maybe you should do some demographics research. It isn’t ”white welfare trash” that are responsible for the draw on the federal government in red states. In my red state, there is a high population of minorities who vote in mass for Democrats. They also get the majority of government assistance per capita. In addition, who do you think the vast majority who are drawing government assistance in every state, red or blue, vote for? Yes, Democrats and it isn’t close. If all Democrats left my state, our government assistance would be minuscule as the overwheming majority of Republicans are self-sufficient.
I would also like to note the taxes in the blue states. The working Democrats who have been brainwashed to vote for Democrats are heavily subsidizing the losers. In red states, the taxes are much lower because we don’t believe it is our responsiblility to pay for such laziness. Democrats are starting to realize just how crazy it is to pay such taxes and they are leaving, but I fear it hasn’t quite clicked as to what exactly caused those taxes and they will continue voting for it in the red states. Indoctrination does quite a number to a person’s objectivity or lack thereof.
Not to worry - Schooling ill-informed RW Kooks is what I do best!
Welfare demographics
- 56 percent of all people living in poverty in 2018 were women. [Source: United States Census Bureau for American Progress]
- More women lived in poverty in the United States than men in 2018, totaling 21.4 million. [Source: United States Census Bureau for American Progress]
- In 2019, 29.9 percent of households receiving SNAP benefits had at least one child aged 18 or younger. [Source: United States Census Bureau]
- In 2019, 12.3 percent of households receiving SNAP benefits were headed by a female without a spouse. [Source: United States Census Bureau]
- Nonfamily households—those whose members aren’t related—accounted for 35.2 percent of SNAP recipients in 2019. [Source: United States Census Bureau]
- 25.6 percent of SNAP households included a disabled person in 2019. [Source: United States Census Bureau]
- The number of SNAP households who were headed by a white person was 75.8 percent in 2019, compared to 12.5 headed by a black person and 13.6 headed by a Hispanic person. [Source: United States Census Bureau]

Important welfare statistics for 2021 - Lexington Law
Poverty remains a widespread problem affecting countless low-income families in the U.S. Here’s a breakdown of the latest welfare statistics for 2021.www.lexingtonlaw.com
The level of indoctrination and number twisting is almost scary here. African Americans make up far more as a percentage of those on food stamps and other federal assistance than whites and it isn’t even close. You pick and choose some head of household statistic that appears to be in your favor to twist. I guess this kind of nonsense is what keeps the ignorant ignorant and assures that Democrats get elected. Pure propaganda and spin mixed in with some lies.
Check out chart number 4 in the link below. Of this receiving food stamps, Black, other, mixed and Hispanic account for the vast majority of food stamps in this country.(84.5%) Whites make up 8.9% while Asians 7.6%. Don’t let the actual facts get in the way. Many Southern red states have a high black population and thus more federal assistance is necessary. BTW, these groups overwhelmingly vote for Democrats.
It is quite ironic that you argue that whites are the ones using SNAP and thus are in the most need and yet the entire narrative pushed by the left is that it is black people that are not getting fair shake. Seems as though you just twist things around to fit whatever narrative you are attempting to ”fact check” at the time. Funny stuff for sure.
The Demographic Statistical Atlas of the United States - Statistical Atlas
 So your claim is that black families are all saying that a white person is head of household? Can't make this shit up (well you CAN - but no one will believe you ;-) Note that my previous numbers were were SNAP only. These include ANY sort of government assistance including Medicaid. I will anticipate your white flag of surrender!
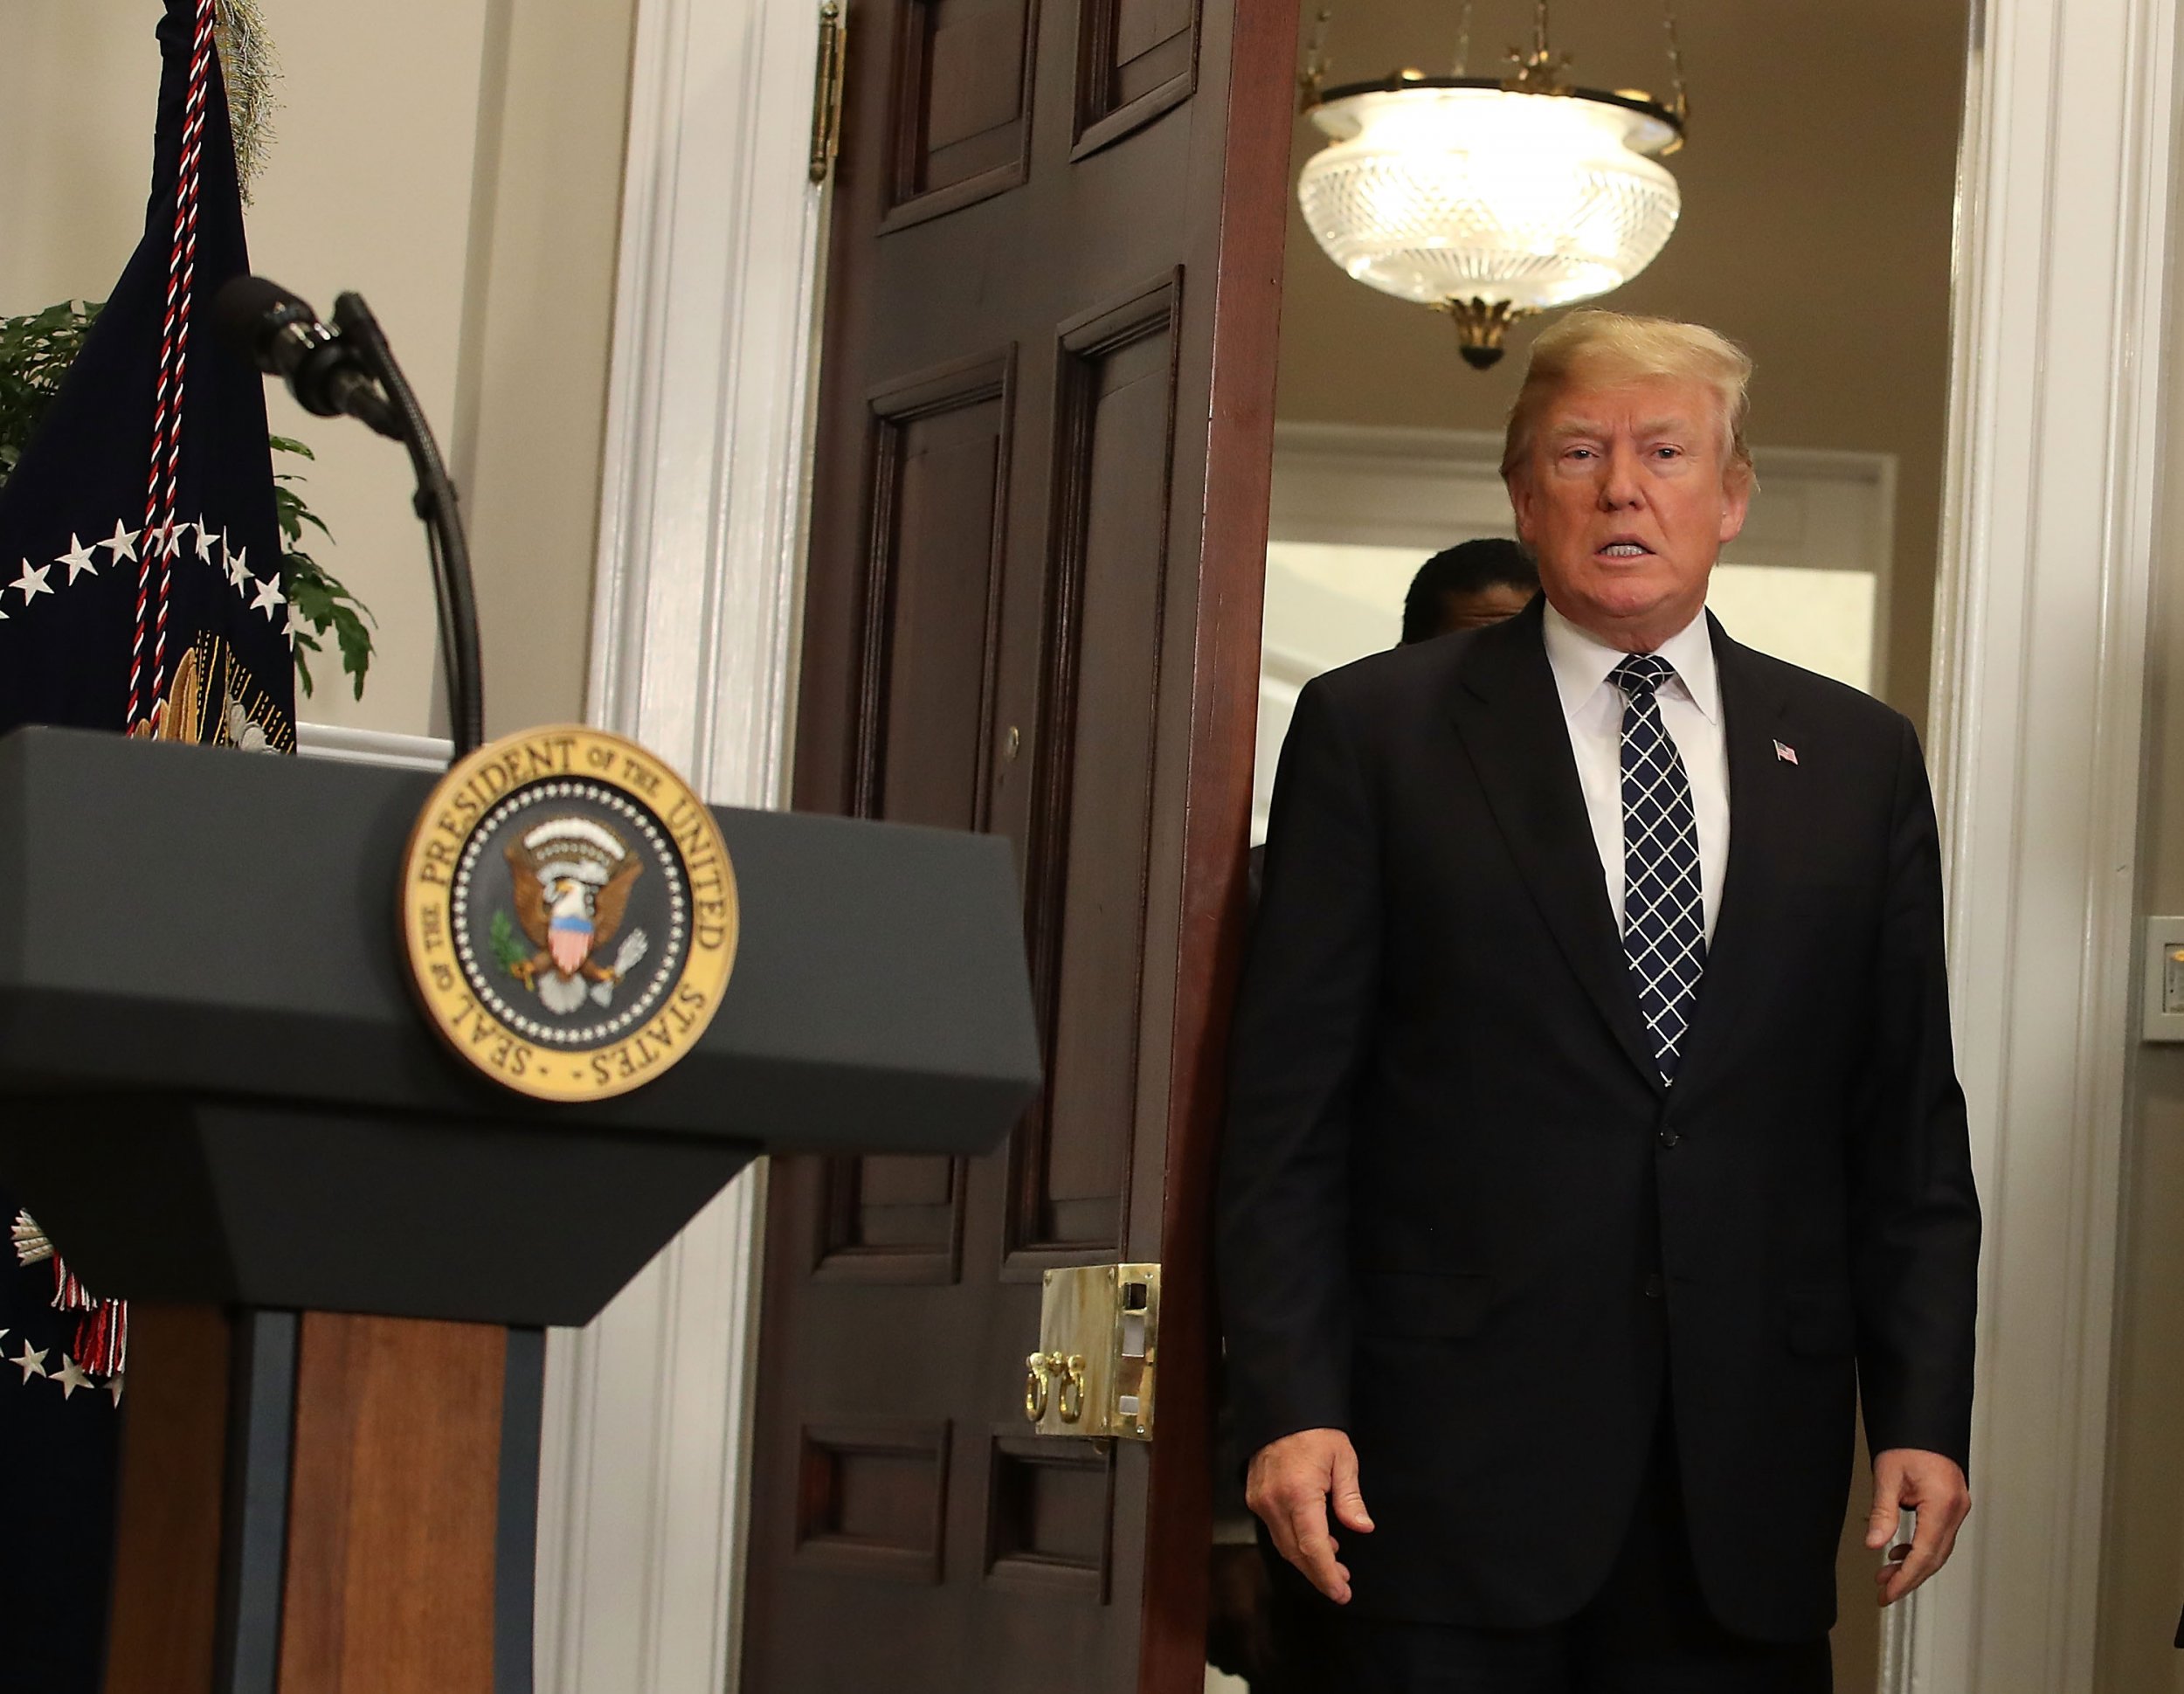
 www.newsweek.com
Poverty is a fact of life. Like the weather we talk a lot about it but we don't do much to change it.LOL..Maybe you should do some demographics research. It isn’t ”white welfare trash” that are responsible for the draw on the federal government in red states. In my red state, there is a high population of minorities who vote in mass for Democrats. They also get the majority of government assistance per capita. In addition, who do you think the vast majority who are drawing government assistance in every state, red or blue, vote for? Yes, Democrats and it isn’t close. If all Democrats left my state, our government assistance would be minuscule as the overwheming majority of Republicans are self-sufficient.
I would also like to note the taxes in the blue states. The working Democrats who have been brainwashed to vote for Democrats are heavily subsidizing the losers. In red states, the taxes are much lower because we don’t believe it is our responsiblility to pay for such laziness. Democrats are starting to realize just how crazy it is to pay such taxes and they are leaving, but I fear it hasn’t quite clicked as to what exactly caused those taxes and they will continue voting for it in the red states. Indoctrination does quite a number to a person’s objectivity or lack thereof.
Not to worry - Schooling ill-informed RW Kooks is what I do best!
Welfare demographics
- 56 percent of all people living in poverty in 2018 were women. [Source: United States Census Bureau for American Progress]
- More women lived in poverty in the United States than men in 2018, totaling 21.4 million. [Source: United States Census Bureau for American Progress]
- In 2019, 29.9 percent of households receiving SNAP benefits had at least one child aged 18 or younger. [Source: United States Census Bureau]
- In 2019, 12.3 percent of households receiving SNAP benefits were headed by a female without a spouse. [Source: United States Census Bureau]
- Nonfamily households—those whose members aren’t related—accounted for 35.2 percent of SNAP recipients in 2019. [Source: United States Census Bureau]
- 25.6 percent of SNAP households included a disabled person in 2019. [Source: United States Census Bureau]
- The number of SNAP households who were headed by a white person was 75.8 percent in 2019, compared to 12.5 headed by a black person and 13.6 headed by a Hispanic person. [Source: United States Census Bureau]
Important welfare statistics for 2021 - Lexington Law
Poverty remains a widespread problem affecting countless low-income families in the U.S. Here’s a breakdown of the latest welfare statistics for 2021.www.lexingtonlaw.com
The level of indoctrination and number twisting is almost scary here. African Americans make up far more as a percentage of those on food stamps and other federal assistance than whites and it isn’t even close. You pick and choose some head of household statistic that appears to be in your favor to twist. I guess this kind of nonsense is what keeps the ignorant ignorant and assures that Democrats get elected. Pure propaganda and spin mixed in with some lies.
Check out chart number 4 in the link below. Of this receiving food stamps, Black, other, mixed and Hispanic account for the vast majority of food stamps in this country.(84.5%) Whites make up 8.9% while Asians 7.6%. Don’t let the actual facts get in the way. Many Southern red states have a high black population and thus more federal assistance is necessary. BTW, these groups overwhelmingly vote for Democrats.
It is quite ironic that you argue that whites are the ones using SNAP and thus are in the most need and yet the entire narrative pushed by the left is that it is black people that are not getting fair shake. Seems as though you just twist things around to fit whatever narrative you are attempting to ”fact check” at the time. Funny stuff for sure.
The Demographic Statistical Atlas of the United States - Statistical Atlas
According to demographic data, 39.8% of SNAP participants are white, 25.5% are African-American, 10.9% are Hispanic, 2.4% are Asian, and 1% are Native American.The level of indoctrination and number twisting is almost scary here. African Americans make up far more as a percentage of those on food stamps and other federal assistance than whites and it isn’t even close. You pick and choose some head of household statistic that appears to be in your favor to twist. I guess this kind of nonsense is what keeps the ignorant ignorant and assures that Democrats get elected. Pure propaganda and spin mixed in with some lies.
Check out chart number 4 in the link below. Of this receiving food stamps, Black, other, mixed and Hispanic account for the vast majority of food stamps in this country.(84.5%) Whites make up 8.9% while Asians 7.6%. Don’t let the actual facts get in the way. Many Southern red states have a high black population and thus more federal assistance is necessary. BTW, these groups overwhelmingly vote for Democrats.
It is quite ironic that you argue that whites are the ones using SNAP and thus are in the most need and yet the entire narrative pushed by the left is that it is black people that are not getting fair shake. Seems as though you just twist things around to fit whatever narrative you are attempting to ”fact check” at the time. Funny stuff for sure.
The Demographic Statistical Atlas of the United States - Statistical Atlas
My stats prove you wrong. 84.5% of those on snap are black?
President Donald Trump was apparently unaware that not all—in fact, the vast majority—of welfare beneficiaries are not black as recently as last March, according to a new report.In the spring of 2017, the newly elected president met with members of the Congressional Black Caucus. During that meeting, one of the members mentioned to Trump that welfare reform would be detrimental to her constituents— adding, "Not all of whom are black," according to NBC News.The president was incredulous. "Really? Then what are they?"In fact, whites are the biggest beneficiaries when it comes to government safety-net programs like the Temporary Assistance for Needy Families, commonly referred to as welfare.White people without a college degree ages 18 to 64 are the largest class of adults lifted out of poverty by such programs, according to the Center on Budget and Policy Priorities.
Trump Thought Only Black People Were on Welfare
President Donald Trump is apparently unaware that not all—in fact, the vast majority—of welfare recipients are not black, according to a new report.
 www.snaptohealth.org
It's very simple, and Trump and the Republicans have it right. It just takes time for the policies we want to take affect.I don't know what the solution is to help these people see that voting for republicans got them in this mess and won't get them out of it.
But I finally saw for myself the reasons why republicans voted for trump.
High taxes and global warming policies have pushed rural America's jobs over seas. The only thing that will bring those jobs back is a competitive tax rate on corporations.
The Democrat's "spread the wealth" agenda is what you see on your trip. The only problem is America is not part of where they WANT to spread the wealth to.
I'm sure some are. Stealing other people's money is becoming quite popular these days.Rural area are actually very supportive of more governmental services to keep their areas alive..
| Country | Obligations | Disbursements |
|---|---|---|
| Iraq | $1.17 Bn | $870.86 Mn |
| Jordan | $1.16 Bn | $855.80 Mn |
| Syria | $819.37 Mn | $694.29 Mn |
| Ethiopia | $806.91 Mn | $815.35 Mn |
| Afghanistan | $760.17 Mn | $809.57 Mn |
| South Sudan | $749.53 Mn | $752.51 Mn |
| Nigeria | $739.50 Mn | $717.92 Mn |
| Dr Congo | $672.06 Mn | $437.97 Mn |
| Yemen | $633.60 Mn | $551.54 Mn |
| Kenya | $591.36 Mn | $613.60 Mn |
| Lebanon | $590.68 Mn | $257.68 Mn |
| Niger | $573.04 Mn | $157.48 Mn |
| Bangladesh | $520.16 Mn | $311.77 Mn |
| Uganda | $482.71 Mn | $433.58 Mn |
| Somalia | $461.83 Mn | $406.41 Mn |
| Tanzania | $422.35 Mn | $422.66 Mn |
| South Africa | $393.44 Mn | $362.68 Mn |
| Pakistan | $370.37 Mn | $438.37 Mn |
| Colombia | $265.90 Mn | $198.08 Mn |
| Sudan | $260.77 Mn | $223.87 Mn |
| Ukraine | $247.30 Mn | $231.72 Mn |
| Mozambique | $220.40 Mn | $300.80 Mn |
| Mali | $215.90 Mn | $197.37 Mn |
| Egypt | $214.35 Mn | $148.90 Mn |
| Malawi | $212.42 Mn | $327.72 Mn |
| Haiti | $207.61 Mn | $265.83 Mn |
| Zimbabwe | $201.36 Mn | $169.33 Mn |
| Senegal | $180.36 Mn | $156.33 Mn |
| Zambia | $180.08 Mn | $331.35 Mn |
| Rwanda | $176.56 Mn | $123.08 Mn |
| Myanmar | $172.18 Mn | $139.38 Mn |
| Russia | $159.42 Mn | $159.33 Mn |
| Turkey | $159.27 Mn | $55.20 Mn |
| Philippines | $149.21 Mn | $137.40 Mn |
| Guatemala | $148.85 Mn | $169.42 Mn |
| Ghana | $141.31 Mn | $185.71 Mn |
| Nepal | $134.57 Mn | $156.92 Mn |
| Ivory Coast | $126.48 Mn | $62.76 Mn |
| Micronesia | $119.01 Mn | $64.22 Mn |
| Tunisia | $118.66 Mn | $36.17 Mn |
| Chad | $113.08 Mn | $79.15 Mn |
| Honduras | $111.54 Mn | $125.19 Mn |
| Madagascar | $109.91 Mn | $95.48 Mn |
| Cameroon | $105.92 Mn | $67.09 Mn |
| Libya | $104.37 Mn | $46.19 Mn |
| Cambodia | $100.30 Mn | $68.23 Mn |
| Burkina Faso | $92.12 Mn | $58.45 Mn |
| Central African Republic | $90.71 Mn | $64.95 Mn |
| El Salvador | $88.23 Mn | $110.19 Mn |
| Liberia | $86.35 Mn | $217.38 Mn |
| India | $85.12 Mn | $110.42 Mn |
| Marshall Islands | $84.38 Mn | $41.87 Mn |
| Vietnam | $83.12 Mn | $77.71 Mn |
| Peru | $82.78 Mn | $55.89 Mn |
| Georgia | $77.77 Mn | $102.04 Mn |
| Palau | $69.08 Mn | $68.11 Mn |
| Burundi | $68.84 Mn | $47.41 Mn |
| Mexico | $68.58 Mn | $62.91 Mn |
| Bosnia And Herzegovina | $63.06 Mn | $39.99 Mn |
| Indonesia | $54.33 Mn | $291.58 Mn |
| Morocco | $53.11 Mn | $61.93 Mn |
| Dominican Republic | $47.05 Mn | $50.77 Mn |
| Guinea | $44.69 Mn | $57.41 Mn |
| Kyrgyzstan | $44.21 Mn | $45.09 Mn |
| Swaziland | $43.16 Mn | $38.20 Mn |
| Lesotho | $42.73 Mn | $53.07 Mn |
| Sri Lanka | $42.53 Mn | $30.64 Mn |
| Tajikistan | $40.47 Mn | $30.40 Mn |
| Mongolia | $38.93 Mn | $15.67 Mn |
| Sierra Leone | $38.42 Mn | $56.33 Mn |
| Angola | $38.24 Mn | $40.59 Mn |
| Thailand | $37.97 Mn | $34.70 Mn |
| Moldova | $35.08 Mn | $34.70 Mn |
| Benin | $32.58 Mn | $53.32 Mn |
| Nicaragua | $30.26 Mn | $27.17 Mn |
| Laos | $29.56 Mn | $8.15 Mn |
| Namibia | $29.38 Mn | $34.45 Mn |
| Jamaica | $29.25 Mn | $36.36 Mn |
| Botswana | $27.39 Mn | $21.52 Mn |
| Canada | $26.09 Mn | -$21.78 Mn |
| China | $25.74 Mn | $32.50 Mn |
| Armenia | $25.59 Mn | $26.90 Mn |
| Venezuela | $25.01 Mn | $15.09 Mn |
| Ecuador | $24.84 Mn | $16.71 Mn |
| Uzbekistan | $23.82 Mn | $10.66 Mn |
| Timor Leste | $22.91 Mn | $20.65 Mn |
| Brazil | $21.31 Mn | $24.47 Mn |
| Macedonia | $21.07 Mn | $24.70 Mn |
| Mauritania | $18.56 Mn | $14.15 Mn |
| Serbia | $18.27 Mn | $18.44 Mn |
| Kazakhstan | $17.03 Mn | $17.46 Mn |
| Paraguay | $15.96 Mn | $18.89 Mn |
| Costa Rica | $15.69 Mn | $9.66 Mn |
| Albania | $15.50 Mn | $16.29 Mn |
| Republic Of The Congo | $15.08 Mn | $2.66 Mn |
| Djibouti | $14.80 Mn | $10.96 Mn |
| Azerbaijan | $13.97 Mn | $12.28 Mn |
| Cuba | $11.90 Mn | $12.29 Mn |
| Israel | $10.77 Mn | $11.03 Mn |
| Malaysia | $10.73 Mn | $8.73 Mn |
| Belarus | $10.19 Mn | $8.27 Mn |
| Panama | $9.79 Mn | $10.77 Mn |
| Dominica | $9.48 Mn | $5.08 Mn |
| Gabon | $8.48 Mn | $866,086 |
| Algeria | $8.36 Mn | $2.25 Mn |
| Austria | $6.21 Mn | $2.23 Mn |
| Argentina | $5.02 Mn | $3.65 Mn |
| Turkmenistan | $4.54 Mn | $3.55 Mn |
| Papua New Guinea | $4.35 Mn | $8.40 Mn |
| Togo | $3.86 Mn | $2.99 Mn |
| Guyana | $3.60 Mn | $3.61 Mn |
| Poland | $3.21 Mn | $3.21 Mn |
| Kuwait | $3.07 Mn | $4.02 Mn |
| Vanuatu | $2.82 Mn | $3.50 Mn |
| Czech Republic | $2.72 Mn | $53,731 |
| Belize | $2.70 Mn | $3.92 Mn |
| North Korea | $2.58 Mn | $3.58 Mn |
| Trinidad And Tobago | $2.52 Mn | $119,608 |
| Gambia | $2.44 Mn | $13.14 Mn |
| Fiji | $1.96 Mn | $2.31 Mn |
| Bolivia | $1.79 Mn | $1.04 Mn |
| Eritrea | $1.54 Mn | $752,006 |
| Samoa | $1.33 Mn | $1.86 Mn |
| Hungary | $1.32 Mn | $1.09 Mn |
| Greece | $1.26 Mn | $404,305 |
| Comoros | $1.23 Mn | $1.15 Mn |
| Tonga | $1.18 Mn | $1.33 Mn |
| Montenegro | $1.04 Mn | $685,480 |
| Iran | $917,676 | $5.48 Mn |
| Ireland | $750,000 | $740,129 |
| Oman | $628,802 | -$22,957 |
| Hong Kong | $564,000 | $699,000 |
| Chile | $558,102 | $2.65 Mn |
| Solomon Islands | $524,998 | $764,229 |
| South Korea | $517,754 | $631,933 |
| Cape Verde | $475,518 | $10.09 Mn |
| Slovenia | $314,528 | $14,528 |
| Suriname | $297,978 | - |
| Guinea Bissau | $258,508 | $388,765 |
| Mauritius | $250,000 | $214,233 |
| Taiwan | $200,000 | $174,756 |
| Latvia | $196,465 | $408,565 |
| Uruguay | $175,179 | $95,438 |
| Equatorial Guinea | $171,014 | $1.12 Mn |
| Saint Kitts And Nevis | $162,566 | $51,867 |
| Japan | $145,220 | $140,220 |
| Portugal | $138,806 | $52,454 |
| United Arab Emirates | $116,128 | $116,812 |
| Spain | $103,753 | $354,185 |
| Saint Lucia | $99,988 | - |
| Bahamas | $91,169 | $281,262 |
| Netherlands | $49,215 | $214,313 |
| Barbados | $46,950 | $80,009 |
| Singapore | $40,500 | $441,132 |
| Malta | $36,463 | $18,963 |
| Bhutan | $31,848 | $167,340 |
| Italy | $25,696 | $3,943 |
| Croatia | $25,000 | $212,255 |
| Estonia | $24,997 | $24,997 |
| Sao Tome And Principe | $24,748 | -$24,748 |
| Saudi Arabia | $17,899 | $58,257 |
| Bulgaria | $13,599 | $1.19 Mn |
| Romania | $7,886 | $1.43 Mn |
| Belgium | $6,000 | $6,000 |
| Grenada | $1,320 | $1,320 |
| Antigua And Barbuda | - | -$83,614 |
| Bahrain | - | $446,567 |
| Lithuania | - | $6,289 |
| Slovakia | - | $503,917 |
| Australia | - | $94 |
| Maldives | -$80 | $5,662 |
| Qatar | -$1,601 | $8,344 |
| Cyprus | -$98,430 | $79,173 |
Those in small towns don't want you to come in with your revival plans.There is not much that can be done to revive most small rural towns.
Opinion polls consistently report that Americans believe foreign aid is about 25% of the federal budget, when it is actually less than 1%. As the world’s wealthiest nation, the U.S. provides more assistance than any other country, but a smaller proportion of its gross national product (GNP) than other wealthy nations.I'm sure some are. Stealing other people's money is becoming quite popular these days.Rural area are actually very supportive of more governmental services to keep their areas alive..
US Foreign Aid by Country 2021
Country Obligations Disbursements Iraq $1.17 Bn $870.86 Mn Jordan $1.16 Bn $855.80 Mn Syria $819.37 Mn $694.29 Mn Ethiopia $806.91 Mn $815.35 Mn Afghanistan $760.17 Mn $809.57 Mn South Sudan $749.53 Mn $752.51 Mn Nigeria $739.50 Mn $717.92 Mn Dr Congo $672.06 Mn $437.97 Mn Yemen $633.60 Mn $551.54 Mn Kenya $591.36 Mn $613.60 Mn Lebanon $590.68 Mn $257.68 Mn Niger $573.04 Mn $157.48 Mn Bangladesh $520.16 Mn $311.77 Mn Uganda $482.71 Mn $433.58 Mn Somalia $461.83 Mn $406.41 Mn Tanzania $422.35 Mn $422.66 Mn South Africa $393.44 Mn $362.68 Mn Pakistan $370.37 Mn $438.37 Mn Colombia $265.90 Mn $198.08 Mn Sudan $260.77 Mn $223.87 Mn Ukraine $247.30 Mn $231.72 Mn Mozambique $220.40 Mn $300.80 Mn Mali $215.90 Mn $197.37 Mn Egypt $214.35 Mn $148.90 Mn Malawi $212.42 Mn $327.72 Mn Haiti $207.61 Mn $265.83 Mn Zimbabwe $201.36 Mn $169.33 Mn Senegal $180.36 Mn $156.33 Mn Zambia $180.08 Mn $331.35 Mn Rwanda $176.56 Mn $123.08 Mn Myanmar $172.18 Mn $139.38 Mn Russia $159.42 Mn $159.33 Mn Turkey $159.27 Mn $55.20 Mn Philippines $149.21 Mn $137.40 Mn Guatemala $148.85 Mn $169.42 Mn Ghana $141.31 Mn $185.71 Mn Nepal $134.57 Mn $156.92 Mn Ivory Coast $126.48 Mn $62.76 Mn Micronesia $119.01 Mn $64.22 Mn Tunisia $118.66 Mn $36.17 Mn Chad $113.08 Mn $79.15 Mn Honduras $111.54 Mn $125.19 Mn Madagascar $109.91 Mn $95.48 Mn Cameroon $105.92 Mn $67.09 Mn Libya $104.37 Mn $46.19 Mn Cambodia $100.30 Mn $68.23 Mn Burkina Faso $92.12 Mn $58.45 Mn Central African Republic $90.71 Mn $64.95 Mn El Salvador $88.23 Mn $110.19 Mn Liberia $86.35 Mn $217.38 Mn India $85.12 Mn $110.42 Mn Marshall Islands $84.38 Mn $41.87 Mn Vietnam $83.12 Mn $77.71 Mn Peru $82.78 Mn $55.89 Mn Georgia $77.77 Mn $102.04 Mn Palau $69.08 Mn $68.11 Mn Burundi $68.84 Mn $47.41 Mn Mexico $68.58 Mn $62.91 Mn Bosnia And Herzegovina $63.06 Mn $39.99 Mn Indonesia $54.33 Mn $291.58 Mn Morocco $53.11 Mn $61.93 Mn Dominican Republic $47.05 Mn $50.77 Mn Guinea $44.69 Mn $57.41 Mn Kyrgyzstan $44.21 Mn $45.09 Mn Swaziland $43.16 Mn $38.20 Mn Lesotho $42.73 Mn $53.07 Mn Sri Lanka $42.53 Mn $30.64 Mn Tajikistan $40.47 Mn $30.40 Mn Mongolia $38.93 Mn $15.67 Mn Sierra Leone $38.42 Mn $56.33 Mn Angola $38.24 Mn $40.59 Mn Thailand $37.97 Mn $34.70 Mn Moldova $35.08 Mn $34.70 Mn Benin $32.58 Mn $53.32 Mn Nicaragua $30.26 Mn $27.17 Mn Laos $29.56 Mn $8.15 Mn Namibia $29.38 Mn $34.45 Mn Jamaica $29.25 Mn $36.36 Mn Botswana $27.39 Mn $21.52 Mn Canada $26.09 Mn -$21.78 Mn China $25.74 Mn $32.50 Mn Armenia $25.59 Mn $26.90 Mn Venezuela $25.01 Mn $15.09 Mn Ecuador $24.84 Mn $16.71 Mn Uzbekistan $23.82 Mn $10.66 Mn Timor Leste $22.91 Mn $20.65 Mn Brazil $21.31 Mn $24.47 Mn Macedonia $21.07 Mn $24.70 Mn Mauritania $18.56 Mn $14.15 Mn Serbia $18.27 Mn $18.44 Mn Kazakhstan $17.03 Mn $17.46 Mn Paraguay $15.96 Mn $18.89 Mn Costa Rica $15.69 Mn $9.66 Mn Albania $15.50 Mn $16.29 Mn Republic Of The Congo $15.08 Mn $2.66 Mn Djibouti $14.80 Mn $10.96 Mn Azerbaijan $13.97 Mn $12.28 Mn Cuba $11.90 Mn $12.29 Mn Israel $10.77 Mn $11.03 Mn Malaysia $10.73 Mn $8.73 Mn Belarus $10.19 Mn $8.27 Mn Panama $9.79 Mn $10.77 Mn Dominica $9.48 Mn $5.08 Mn Gabon $8.48 Mn $866,086 Algeria $8.36 Mn $2.25 Mn Austria $6.21 Mn $2.23 Mn Argentina $5.02 Mn $3.65 Mn Turkmenistan $4.54 Mn $3.55 Mn Papua New Guinea $4.35 Mn $8.40 Mn Togo $3.86 Mn $2.99 Mn Guyana $3.60 Mn $3.61 Mn Poland $3.21 Mn $3.21 Mn Kuwait $3.07 Mn $4.02 Mn Vanuatu $2.82 Mn $3.50 Mn Czech Republic $2.72 Mn $53,731 Belize $2.70 Mn $3.92 Mn North Korea $2.58 Mn $3.58 Mn Trinidad And Tobago $2.52 Mn $119,608 Gambia $2.44 Mn $13.14 Mn Fiji $1.96 Mn $2.31 Mn Bolivia $1.79 Mn $1.04 Mn Eritrea $1.54 Mn $752,006 Samoa $1.33 Mn $1.86 Mn Hungary $1.32 Mn $1.09 Mn Greece $1.26 Mn $404,305 Comoros $1.23 Mn $1.15 Mn Tonga $1.18 Mn $1.33 Mn Montenegro $1.04 Mn $685,480 Iran $917,676 $5.48 Mn Ireland $750,000 $740,129 Oman $628,802 -$22,957 Hong Kong $564,000 $699,000 Chile $558,102 $2.65 Mn Solomon Islands $524,998 $764,229 South Korea $517,754 $631,933 Cape Verde $475,518 $10.09 Mn Slovenia $314,528 $14,528 Suriname $297,978 - Guinea Bissau $258,508 $388,765 Mauritius $250,000 $214,233 Taiwan $200,000 $174,756 Latvia $196,465 $408,565 Uruguay $175,179 $95,438 Equatorial Guinea $171,014 $1.12 Mn Saint Kitts And Nevis $162,566 $51,867 Japan $145,220 $140,220 Portugal $138,806 $52,454 United Arab Emirates $116,128 $116,812 Spain $103,753 $354,185 Saint Lucia $99,988 - Bahamas $91,169 $281,262 Netherlands $49,215 $214,313 Barbados $46,950 $80,009 Singapore $40,500 $441,132 Malta $36,463 $18,963 Bhutan $31,848 $167,340 Italy $25,696 $3,943 Croatia $25,000 $212,255 Estonia $24,997 $24,997 Sao Tome And Principe $24,748 -$24,748 Saudi Arabia $17,899 $58,257 Bulgaria $13,599 $1.19 Mn Romania $7,886 $1.43 Mn Belgium $6,000 $6,000 Grenada $1,320 $1,320 Antigua And Barbuda - -$83,614 Bahrain - $446,567 Lithuania - $6,289 Slovakia - $503,917 Australia - $94 Maldives -$80 $5,662 Qatar -$1,601 $8,344 Cyprus -$98,430 $79,173
We should never give a penny to countries who hate us.US Foreign Aid has proved itself essential to furthering US foreign policy.
Foreign aid is a two way street, it benefits both giver and the receiver. The benefit to the receiver is obvious but the benefit to giver is often obscure. For starters, we are able to stop deadly diseases before they reach our shores, promote American exports, counter violent extremism, combat climate change and Russian hacking, and support our overseas embassies and strategic allies across the world. There are always strings attached to foreign and there is always negotiations. We don't give away foreign aid, we use foreign aid as a bargaining chip to do things like get favorable trade status, secure fly over rights for the military or other military needs, controls to insure aid goes where it is intended, cooperation in war on terror, changes to extradition policies, cultural exchanges, etc... Only about half of the foreign aid offers from the US are accepted. Whether foreign aid offers come from the US, Russia, China, or other, receiving countries known that there will be a price to be paid.We should never give a penny to countries who hate us.US Foreign Aid has proved itself essential to furthering US foreign policy.