Republicans: Can we pump CO2 into atmosphere indefinitely?

Brambo

Member
Sep 8, 2016
422
24
18
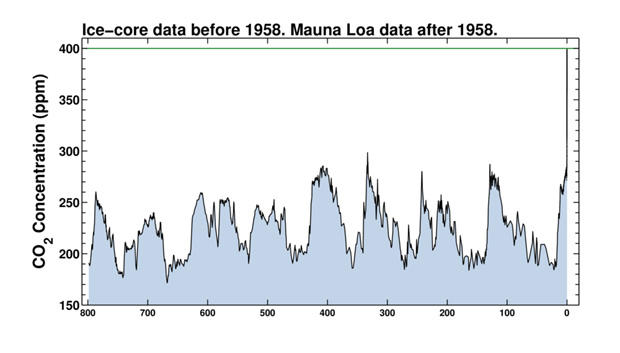
So we all see the graph where it shows cyclical CO2 patterns, and then it goes off the chart...realize those cyclical CO2 patterns are cycles of about 100,000 years.

Here is an example:
co2-800k-620x353.jpg


Really pause and think for a moment....

At the rate the CO2 is climbing, in just ONE of the past cycles, we would have over 200,000ppm CO2 in the Atmosphere.

That's 20% CO2 concentration in the atmosphere. Which will kill ALL life on Earth. Even plants can't "Breathe" in an atmosphere with that much CO2.

That's how much CO2 we are pumping into the atmosphere, that's how bad it is.

And Republicans simply say this is not a problem, this can continue, indefinitely.

They clearly think we can, or else they would acknowledge that it is a poison and we must STOP.
 
Too funny...

Do you even have an inkling of how much sequestered carbon there is or that we could burn every ounce of fossil fuels on earth and not exceed 7,000ppm, which the earth as withstood before..

I love the propaganda crap your spewing and lack of empirical evidence or facts.. its pure entertainment gold.. And more conflation of CO2 and carbon soot...
 
Last edited:
No, the Earth has not 'withstood' that amount of CO2 with the sun as warm as it is at present

.Do high levels of CO2 in the past contradict the warming effect of CO2?

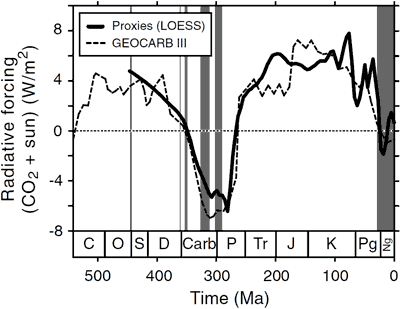
Atmospheric CO2 levels have reached spectacular values in the deep past, possibly topping over 5000 ppm in the late Ordovician around 440 million years ago. However, solar activity also falls as you go further back. In the early Phanerozoic, solar output was about 4% less than current levels. The combined net effect from CO2 and solar variations are shown in Figure 2. Periods of geographically widespread ice are indicated by shaded areas.

Phanerozoic_Forcing.gif

Figure 2: Combined radiative forcing from CO2 and sun through the Phanerozoic. Values are expressed relative to pre-industrial conditions (CO2 = 280 ppm; solar luminosity = 342 W/m2). The dark shaded bands correspond to periods with strong evidence for geographically widespread ice.


Bwhaaaaaaa...
PhanerozoicCO2-Temperatures.jpg


Goldie Rocks is such a lying piece of crap...
 
Do high levels of CO2 in the past contradict the warming effect of CO2?

Research examining strontium isotopes in the sediment record shed more light on this question (Young 2009). Rock weathering removes CO2 from the atmosphere. The process also produces a particular isotope of strontium, washed down to the oceans via rivers. The ratio of strontium isotopes in sediment layers can be used to construct a proxyrecord of continental weathering activity. The strontium record shows that around the middle Ordovician, weatherability increased leading to an increased consumption of CO2. However, this was balanced by increased volcanic outgassing adding CO2 to theatmosphere. Around 446 million years ago, volcanic activity dropped while rock weathering remained high. This caused CO2 levels to fall below 3000 ppm, initiating cooling. It turns out falling CO2 levels was the cause of late Ordovician glaciation.

So we see that comparisons of present day climate to periods 500 million years ago need to take into account that the sun was less active than now. What about times closer to home? The last time CO2 was similar to current levels was around 3 million years ago, during the Pliocene. Back then, CO2 levels remained at around 365 to 410 ppm for thousands of years. Arctic temperatures were 11 to 16°C warmer (Csank 2011). Global temperatures over this period is estimated to be 3 to 4°C warmer than pre-industrial temperatures. Sea levels were around 25 metres higher than current sea level (Dwyer 2008).

If climate scientists were claiming CO2 was the only driver of climate, then high CO2during glacial periods would be problematic. But any climate scientist will tell you CO2 is not the only driver of climate. Climatologist Dana Royer says it best: "the geologic record contains a treasure trove of 'alternative Earths' that allow scientists to study how the various components of the Earth system respond to a range of climatic forcings." Past periods of higher CO2 do not contradict the notion that CO2 warms global temperatures. On the contrary, they confirm the close coupling between CO2 and climate.

Now Silly Billy continues to earn his moniker. After all, it is only the "Conservatives" that seem think that CO2 alone drives the climate. Those researching climate and weather will tell you right up front that is not the case, and point out the geological history of the Earth. But then, what else to expect from a group that worship willful ignorance?
 
So we all see the graph where it shows cyclical CO2 patterns, and then it goes off the chart...realize those cyclical CO2 patterns are cycles of about 100,000 years.

Here is an example:

co2-800k-620x353.jpg


Really pause and think for a moment....

At the rate the CO2 is climbing, in just ONE of the past cycles, we would have over 200,000ppm CO2 in the Atmosphere.

That's 20% CO2 concentration in the atmosphere. Which will kill ALL life on Earth. Even plants can't "Breathe" in an atmosphere with that much CO2.

That's how much CO2 we are pumping into the atmosphere, that's how bad it is.

And Republicans simply say this is not a problem, this can continue, indefinitely.

They clearly think we can, or else they would acknowledge that it is a poison and we must STOP.

Silly goose. You got punked by simple numbers. The pre-industrial conc of CO2 was about 280ppm,. We are at 400 ppm.. In that 150 years or so -- we havent even DOUBLED the amount. And it's generally accepted by all sides that WITHOUT the theories of GW accelerations and feedback, that a doubling would result in about a degC of warming.

Since the warming power of power of CO2 is NOT LINEAR --- to get the next doubling requires TWICE the amount that's been increased in 150 years and wont reach a first doubling for at least the next 30 or 50 years.

So if our energy outlook didn't CHANGE for a million years -- maybe your nightmare would come true.

But you got PUNKED -- because the Horz of your kiddie graph didn't tell you that was in MILLIONS of years !!!!
And because I fear you DON'T KNOW that the data in that graph was produced with insufficient time resolution to show OTHER natural variations and actual 100 year maxima like ours.

You live in fear and swim in sheer propaganda. Maybe learning some of the basics would help you focus on OTHER extremely important environmental issues that have been TOTALLY ignored for awhile.,.
 
So, you have a link showing greenhouse warming has to produce a tropospheric hotspot?
 
Once again, crick is demanding the 5,436th link to the FUDGING that occurred in 2005, when the Tippys took highly correlated satellite and balloon data showing NO WARMING in the atmosphere and FUDGED both (with uncorrelated "corrections") to show "warming" that never existed in reality...

Main argument against climate models proven incorrect | Weather Underground


"data from weather satellites and balloon instruments show no warming whatsoever"


and indeed, since 2005 the same instruments also show NO WARMING since the first FUDGING, requiring a second FUDGING during the past three years...

Google

In other words, after the "pause" started making news, there was a fresh round of FUDGING, and now the "pause" didn't happen... LOL...
 
Once again, crick is demanding the 5,436th link to the FUDGING that occurred in 2005, when the Tippys took highly correlated satellite and balloon data showing NO WARMING in the atmosphere and FUDGED both (with uncorrelated "corrections") to show "warming" that never existed in reality...

Main argument against climate models proven incorrect | Weather Underground

"data from weather satellites and balloon instruments show no warming whatsoever"

Could you explain what could possibly motivate you to repeatedly use an article whose sole purpose is to show that this quote from S Fred Singer is wrong, to support Singer's charge? Wouldn't it make more sense for you to go to Singer's work?

What I asked you for, and which you have NEVER provided, is a link to a reputable article by a qualified scientist demonstrating to us that a hotspot in the lower troposphere is a necessary outcome of greenhouse warming.

So, try, try again.
 
The TRUTH - highly correlated raw data from satellites and balloons showed precisely NO WARMING until 2005 when it was FUDGED for purely UNSCIENTIFIC reasons...

CO2 increased and atmospheric temps did not.

Your theory should have been rejected, but it wasn't, and the reason why is LEFT WING GREED.
 
Once again, crick is demanding the 5,436th link to the FUDGING that occurred in 2005, when the Tippys took highly correlated satellite and balloon data showing NO WARMING in the atmosphere and FUDGED both (with uncorrelated "corrections") to show "warming" that never existed in reality...

Main argument against climate models proven incorrect | Weather Underground

"data from weather satellites and balloon instruments show no warming whatsoever"

Could you explain what could possibly motivate you to repeatedly use an article whose sole purpose is to show that this quote from S Fred Singer is wrong, to support Singer's charge? Wouldn't it make more sense for you to go to Singer's work?

What I asked you for, and which you have NEVER provided, is a link to a reputable article by a qualified scientist demonstrating to us that a hotspot in the lower troposphere is a necessary outcome of greenhouse warming.

So, try, try again.
go read John Christy!!!
slide1.png
 
Your satellite and balloon data is the fudged "corrected" data. The real raw data is a completely flat line with slight ups and downs. Indeed, in 1998, then the "warmest year on record," both the balloons and satellites showed a cooler than normal atmosphere that year...
 
So we all see the graph where it shows cyclical CO2 patterns, and then it goes off the chart...realize those cyclical CO2 patterns are cycles of about 100,000 years.

Here is an example:

co2-800k-620x353.jpg


Really pause and think for a moment....

At the rate the CO2 is climbing, in just ONE of the past cycles, we would have over 200,000ppm CO2 in the Atmosphere.

That's 20% CO2 concentration in the atmosphere. Which will kill ALL life on Earth. Even plants can't "Breathe" in an atmosphere with that much CO2.

That's how much CO2 we are pumping into the atmosphere, that's how bad it is.

And Republicans simply say this is not a problem, this can continue, indefinitely.

They clearly think we can, or else they would acknowledge that it is a poison and we must STOP.

Can you keep your head up your ass indefinitely?

Apparently so...
 
I just posted six peer reviewed journal articles on the Greenland ice mass balance. How about you? Or Walty? Anything?
 

Forum List

Back
Top