Hothouse Gas Spikes to Extreme 409.3 Parts Per Million on April 10 — Record Rate of Atmospheric CO2

Earth's Temperature Just Shattered the Thermometer
Source: Bloomberg

Only three months in, and 2016 will almost certainly be the hottest year on record.

April 19, 2016
By Tom Randall

The Earth is warming so fast that it's surprising even the climate scientists who predicted this was coming.

Last month was the hottest March in 137 years of record keeping, according to data released Tuesday by the National Oceanic and Atmospheric Administration. It's the 11th consecutive month to set a new record, and it puts 2016 on course to set a third straight annual record.

Now, it might seem premature to talk about setting a new yearly record after just three months of data, but these months have been such an extreme departure from the norm that Gavin Schmidt, who directs NASA's Goddard Institute for Space Studies, has already made the call.

"I estimate 99 percent chance of an annual record in 2016," Schmidt wrote on Twitter last week, after NASA released its own record climate readings. A month ago—following the release of February's data—Schmidt wrote, simply, "Wow."


Read more: Earth's Temperature Just Shattered the Thermometer
Baby-facepalm.jpg
 
Co2 is a trace gas. There is zero proof it is the sole factor on the climate.:coffee:Only the AGW religion believes that.

The Discovery of Global Warming March 2015

The Carbon Dioxide Greenhouse Effect
In the 19th century, scientists realized that gases in the atmosphere cause a "greenhouse effect" which affects the planet's temperature. These scientists were interested chiefly in the possibility that a lower level of carbon dioxide gas might explain the ice ages of the distant past. At the turn of the century, Svante Arrhenius calculated that emissions from human industry might someday bring a global warming. Other scientists dismissed his idea as faulty. In 1938, G.S. Callendar argued that the level of carbon dioxide was climbing and raising global temperature, but most scientists found his arguments implausible. It was almost by chance that a few researchers in the 1950s discovered that global warming truly was possible. In the early 1960s, C.D. Keeling measured the level of carbon dioxide in the atmosphere: it was rising fast. Researchers began to take an interest, struggling to understand how the level of carbon dioxide had changed in the past, and how the level was influenced by chemical and biological forces. They found that the gas plays a crucial role in climate change, so that the rising level could gravely affect our future.

The Other Greenhouse Gases.Theories are discussed in the essay on Simple Models of Climate.)

To get an overview, start with Summary: the Story in a Nutshell and then come back here.
Baby-facepalm.jpg
 
What Goes Down…
Thegreenhouse effectworks like this: Energy arrives from the sun in the form of visible light and ultraviolet radiation. The Earth then emits some of this energy asinfrared radiation.Greenhouse gases in theatmosphere'capture' some of thisheat, then re-emit it in all directions - including back to the Earth's surface.

Through this process,CO2and other greenhouse gases keep the Earth’s surface 33°Celsius (59.4°F) warmer than it would be without them. We have added 42% moreCO2, and temperatures have gone up. There should be some evidence that linksCO2to the temperature rise.

So far, the average global temperature has gone up by about 0.8 degrees C (1.4°F):

"According to an ongoing temperature analysis conducted by scientists at NASA’s Goddard Institute for Space Studies (GISS)…the average global temperature on Earth has increased by about 0.8°Celsius (1.4°Fahrenheit) since 1880. Two-thirds of the warming has occurred since 1975, at a rate of roughly 0.15-0.20°C per decade."

The temperatures are going up, just like the theory predicted. But where’s the connection withCO2, or other greenhouse gases like methane,ozone or nitrous oxide?

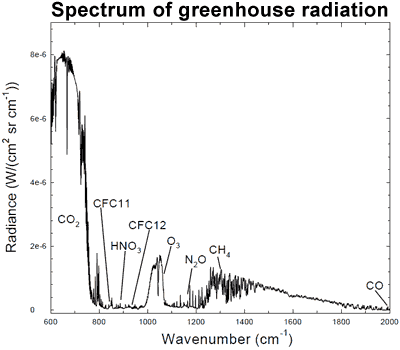
The connection can be found in the spectrum of greenhouse radiation. Using high-resolution FTIR spectroscopy, we can measure the exact wavelengths of long-wave (infrared) radiation reaching the ground.


Greenhouse_Spectrum.gif


Figure 1: Spectrum of the greenhouse radiation measured at the surface.Greenhouse effect from water vapour is filtered out, showing the contributions of other greenhouse gases (Evans 2006).

Sure enough, we can see that CO2is adding considerable warming, along with ozone(O3) and methane (CH4). This is called surface radiative forcing, and the measurements are part of the empirical evidence thatCO2is causing the warming.

How do we know more CO2 is causing warming?
but yet you can't explain that during the solar minimum there is less incoming UV rays meaning less LWIR that will be reemitted into the atmosphere, so less LWIR means less heat period. So you still don't get it. You keep posting up whacked up shit that makes no sense. I'll keep laughing at you.
 
What Goes Down…
Thegreenhouse effectworks like this: Energy arrives from the sun in the form of visible light and ultraviolet radiation. The Earth then emits some of this energy asinfrared radiation.Greenhouse gases in theatmosphere'capture' some of thisheat, then re-emit it in all directions - including back to the Earth's surface.

Through this process,CO2and other greenhouse gases keep the Earth’s surface 33°Celsius (59.4°F) warmer than it would be without them. We have added 42% moreCO2, and temperatures have gone up. There should be some evidence that linksCO2to the temperature rise.

So far, the average global temperature has gone up by about 0.8 degrees C (1.4°F):

"According to an ongoing temperature analysis conducted by scientists at NASA’s Goddard Institute for Space Studies (GISS)…the average global temperature on Earth has increased by about 0.8°Celsius (1.4°Fahrenheit) since 1880. Two-thirds of the warming has occurred since 1975, at a rate of roughly 0.15-0.20°C per decade."

The temperatures are going up, just like the theory predicted. But where’s the connection withCO2, or other greenhouse gases like methane,ozone or nitrous oxide?

The connection can be found in the spectrum of greenhouse radiation. Using high-resolution FTIR spectroscopy, we can measure the exact wavelengths of long-wave (infrared) radiation reaching the ground.


Greenhouse_Spectrum.gif


Figure 1: Spectrum of the greenhouse radiation measured at the surface.Greenhouse effect from water vapour is filtered out, showing the contributions of other greenhouse gases (Evans 2006).

Sure enough, we can see that CO2is adding considerable warming, along with ozone(O3) and methane (CH4). This is called surface radiative forcing, and the measurements are part of the empirical evidence thatCO2is causing the warming.

How do we know more CO2 is causing warming?
and yet thanks to skooks, here is a NASA link to say bullshit to your link:

New NASA Data Blow Gaping Hole In Global Warming Alarmism

Excerpt:
NASA satellite data from the years 2000 through 2011 show the Earth's atmosphere is allowing far more heat to be released into space than alarmist computer models have predicted, reports a new study in the peer-reviewed science journal Remote Sensing. The study indicates far less future global warming will occur than United Nations computer models have predicted, and supports prior studies indicating increases in atmospheric carbon dioxide trap far less heat than alarmists have claimed.

oopppppps
 
but yet you can't explain that during the solar minimum there is less incoming UV rays meaning less LWIR that will be reemitted into the atmosphere, so less LWIR means less heat period. So you still don't get it. You keep posting up whacked up shit that makes no sense. I'll keep laughing at you.

Climate Myth...
It's the sun
"Over the past few hundred years, there has been a steady increase in the numbers of sunspots, at the time when the Earth has been getting warmer. The data suggests solar activity is influencing the global climate causing the world to get warmer." (BBC)

Over the last 35 years the sun has shown a slight cooling trend. However global temperatures have been increasing. Since the sun and climate are going in opposite directions scientists conclude the sun cannot be the cause of recent global warming.

The only way to blame the sun for the current rise in temperatures is by cherry picking the data. This is done by showing only past periods when sun and climate move together and ignoring the last few decades when the two are moving in opposite directions.


Figure 1: Annual global temperature change (thin light red) with 11 year moving average of temperature (thick dark red). Temperature from NASA GISS. Annual Total Solar Irradiance (thin light blue) with 11 year moving average of TSI (thick dark blue). TSI from 1880 to 1978 from Krivova et al 2007 (data). TSI from 1979 to 2015 from PMOD (see the PMOD index page for data updates).
 
flacaltenn said:
New Zealand YET TO RECORD ANY READING over 400ppm..

Obviously.

Most industry and CO2 emissions come from the northern hemisphere. The atmosphere does not have much circulation across the equator, so the southern hemisphere lags behind in CO2 increase.

Also, more ocean area in the south means more CO2 sinking in the south.
 
but yet you can't explain that during the solar minimum there is less incoming UV rays meaning less LWIR that will be reemitted into the atmosphere, so less LWIR means less heat period. So you still don't get it. You keep posting up whacked up shit that makes no sense. I'll keep laughing at you.

Climate Myth...
It's the sun
"Over the past few hundred years, there has been a steady increase in the numbers of sunspots, at the time when the Earth has been getting warmer. The data suggests solar activity is influencing the global climate causing the world to get warmer." (BBC)

Over the last 35 years the sun has shown a slight cooling trend. However global temperatures have been increasing. Since the sun and climate are going in opposite directions scientists conclude the sun cannot be the cause of recent global warming.

The only way to blame the sun for the current rise in temperatures is by cherry picking the data. This is done by showing only past periods when sun and climate move together and ignoring the last few decades when the two are moving in opposite directions.


Figure 1: Annual global temperature change (thin light red) with 11 year moving average of temperature (thick dark red). Temperature from NASA GISS. Annual Total Solar Irradiance (thin light blue) with 11 year moving average of TSI (thick dark blue). TSI from 1880 to 1978 from Krivova et al 2007 (data). TSI from 1979 to 2015 from PMOD (see the PMOD index page for data updates).

well actually, it is already been published we are in a solar minimum, with that that means less LWIR. Unless you have magic, you can't make more LWIR without the sun. so sir you're shit out of luck with your premise. Sorry, it's science.
 
flacaltenn said:
New Zealand YET TO RECORD ANY READING over 400ppm..

Obviously.

Most industry and CO2 emissions come from the northern hemisphere. The atmosphere does not have much circulation across the equator, so the southern hemisphere lags behind in CO2 increase.

Also, more ocean area in the south means more CO2 sinking in the south.
and less LWIR means less warming or cooling. So?
 
flacaltenn said:
New Zealand YET TO RECORD ANY READING over 400ppm..

Obviously.

Most industry and CO2 emissions come from the northern hemisphere. The atmosphere does not have much circulation across the equator, so the southern hemisphere lags behind in CO2 increase.

Also, more ocean area in the south means more CO2 sinking in the south.

"Most industry and CO2 emissions come from the northern hemisphere. "

WRONG!... The tropics and jungles produce far more than industry does... Why do you lie about EVERYTHING?
 
Last edited:
Earth's Temperature Just Shattered the Thermometer
Source: Bloomberg

Only three months in, and 2016 will almost certainly be the hottest year on record.

April 19, 2016
By Tom Randall

The Earth is warming so fast that it's surprising even the climate scientists who predicted this was coming.

Last month was the hottest March in 137 years of record keeping, according to data released Tuesday by the National Oceanic and Atmospheric Administration. It's the 11th consecutive month to set a new record, and it puts 2016 on course to set a third straight annual record.

Now, it might seem premature to talk about setting a new yearly record after just three months of data, but these months have been such an extreme departure from the norm that Gavin Schmidt, who directs NASA's Goddard Institute for Space Studies, has already made the call.

"I estimate 99 percent chance of an annual record in 2016," Schmidt wrote on Twitter last week, after NASA released its own record climate readings. A month ago—following the release of February's data—Schmidt wrote, simply, "Wow."


Read more: Earth's Temperature Just Shattered the Thermometer

Shattered?....a global mean "shattered" the record by a hundredth of a degree?....a global data base that has been heavily manipulated "shattered" the record by a hundredth of a degree and you post that with a straight face and fear catastrophe? What the hell is wrong with you?
 
Earth's Temperature Just Shattered the Thermometer
Source: Bloomberg


Shattered?....a global mean "shattered" the record by a hundredth of a degree?....a global data base that has been heavily manipulated "shattered" the record by a hundredth of a degree and you post that with a straight face and fear catastrophe? What the hell is wrong with you?

Nothing is wrong with me....your issue is with editors of Bloomberg who chose that headline at their highly respected and consulted web site ...its in my post let me reprise:
Earth's Temperature Just Shattered the Thermometer
Source: Bloomberg
 
Heavy Industry Manufacturing Wind Turbines and Solar Panels has exploded, the difference in CO2 from five years ago and today is directly from Solar and Wind industry manufacturers.
 
WRONG!... The tropics and jungles produce far more than industry does... Why do you lie about EVERYTHING?

And they absorb it again. Equilibrium, dumbass. Have an adult explain it to you.

You're like the Oracle of Stupidity. After reading any of your bizarre claims, people can safely conclude the exact opposite is true. That's how reliably wrong you are.
 

Forum List

Back
Top