ScienceRocks
Democrat all the way!
- Banned
- #1
Hothouse Gas Spikes to Extreme 409.3 Parts Per Million on April 10 — Record Rate of Atmospheric CO2 Increase Likely for 2016

Is it possible that one of the carbon sinks has blown?
Simply put, a rapid atmospheric accumulation of greenhouse gasses is swiftly pushing the Earth well outside of any climate context that human beings are used to. The influence of an extreme El Nino on the world ocean system’s ability to take down a massive human carbon emission together with signs of what appears to be a significantly smaller but growing emission from global carbon stores looks to be setting the world up for another record jump in atmospheric CO2 levels during 2016.
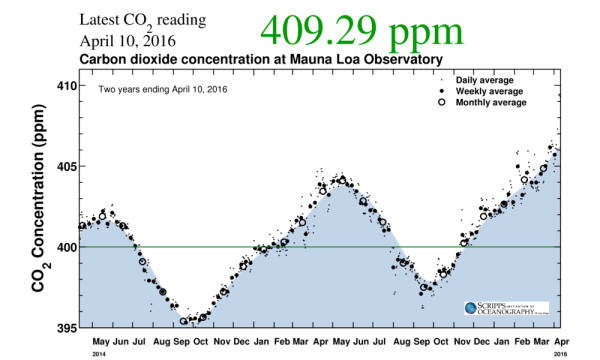
(See the little dot well above the blue trend line on the upper right hand portion of the above graph? That mark’s no accident. It represents daily atmospheric CO2 readings of around 409.3 parts per million CO2 at the Mauna Loa Observatory on April 10 of 2016. It’s an insanely high reading. But over the next two months we may see daily values continue to peak in this range or hit even higher levels. Image source: The Keeling Curve.)
Already, as we near the annual peak during late April through early May, major CO2 spikes are starting to show up. On Sunday, April 10 the Mauna Loa Observatory recorded a daily CO2 reading in the extraordinary range of 409.3 parts per million. These readings follow March monthly averages near 405 parts per million and precede an annual monthly peak in May that’s likely to hit above 407 parts per million and may strike as high as 409 parts per million. These are levels about 135 to 235 parts per million above the average interglacial to ice age range for CO2 levels during the relatively stable climate period of the last 2 million years.
In other words — atmospheric CO2 levels continue to climb into unprecedented ranges. Levels that are increasingly out-of-context scary. For we haven’t seen readings of this heat trapping gas hit so high in any time during at least the past 15 million years.
2016 Could See Atmospheric CO2 Increase by 3.1 to 5.1 Parts Per Million Above 2015
During a ‘normal’ year, if this period of reckless human fossil fuel burning can be rationally compared to anything ‘normal,’ we’d expect CO2 levels to rise by around 2 parts per million. Such a jump in the 2015 to 2016 period would result in monthly averages peaking around 406 parts per million by May. However, with a record El Nino and other influences producing large areas of abnormally warm sea surfaces, the world ocean’s ability to draw down both the massive human emission and the apparently much smaller, but seemingly growing, global carbon feedback has been hampered.
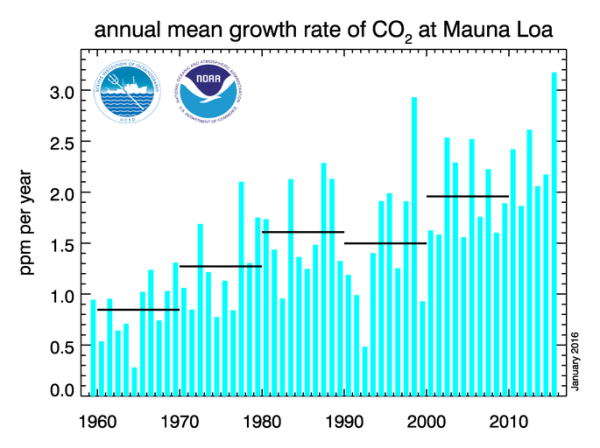
(Annual mean CO2 growth rate for 2016 is likely to hit even higher than records seen during 2015 due to the influence of a record El Nino on the world ocean system’s ability to draw down excess atmospheric carbon and due to the fact that global CO2 emission remain near record high levels set in 2014. Image source: NOAA ESRL.)
In 1998, during a then record El Nino and at a time when global carbon emissions from human sources were significantly lower than they are today and during a period when the global carbon stores appeared to be mostly dormant, atmospheric CO2 levels rose by a then record 2.9 parts per million. During 2015, as a record El Nino ramped up and as the global carbon stores continued their ominous rumbling, annual average increases hit a new high of 3.05 parts per million. But with the strongest El Nino impacts hampering ocean carbon draw-down extending on into the current year, it appears that 2016 average rates of atmospheric CO2 increase are likely to be even higher. Due to this, hopefully temporary, reduction in the ocean’s ability to take in atmospheric carbon, we’re likely to see May 2016 CO2 levels at Mauna Loa hit a range of 3.1 to 5.1 parts per million (407 to 409 ppm in total) above previous record high levels of around 403.9 parts per million for the same month during 2015.
The Last Time CO2 Values Were So High Was During the Middle Miocene — 15 Million Years in the Earth’s Deep Past
By any yardstick, these are extreme annual rates of atmospheric CO2 increase. Rates that are likely at least an order of magnitude faster than during the last hothouse extinction — the PETM — 55 million years ago. Just a few years ago, the scientific bodies of the world voiced serious concern about atmospheric CO2 levels equaling those seen during the Pliocene period — a geological epoch 3-5 million years ago when Earth temperatures were 2-3 C warmer than they are today and atmospheric CO2 levels ranged between 390 and 405 parts per million. But in just a brief interval, we’ve blown past that potential paleoclimate context and into another, more difficult, much warmer, world. A period further back into the great long ago when human civilization as it is today couldn’t have been imagined and a species called homo sapiens had millions of years yet to even begin to exist.
(For the week ending April 10, it appears that atmospheric CO2 levels have already averaged above 407 parts per million. Over the next two months, global atmospheric levels will reach new record highs likely in the range of 407 to 409 parts per million in the monthly values representing an extreme jump in readings of this key heat trapping gas. Image source: NOAA ESRL.)
For it’s been about 15 million years since we’ve seen atmospheric values of this critical greenhouse gas hit levels so high. Back then, the Earth was about 3-5 degrees Celsius hotter than the 19th Century and oceans were about 120 to 190 feet higher. Maintaining current greenhouse gas levels in this range for any extended will risk reverting to climate states similar to those of the Middle Miocene past — or potentially warmer if global carbon stores laid down during the period of the last 15 million years of cooling are again released into the Earth’s ocean and atmosphere.
At current annual rates of atmospheric CO2 increase, it will take between 20 and 50 years to exceed the Miocene and Ogliocene range of 405 to 520 parts per million CO2. At that point, we would be hitting CO2 levels high enough to wipe out most or all of the glacial ice on Earth. That’s basically what happens if we keep burning fossil fuels as we are now for another few decades.
In any case, it’s worth noting that 2016’s potential annual atmospheric CO2 increase of between 3.1 and 5.1 parts per million is extraordinarily bad. Something we shouldn’t be doing to the Earth’s climate system. There really is no other way to say it. Such rates of hothouse gas increases are absolutely terrible.
Is it possible that one of the carbon sinks has blown?

