DC....coolest May since......ahem......1882!!!

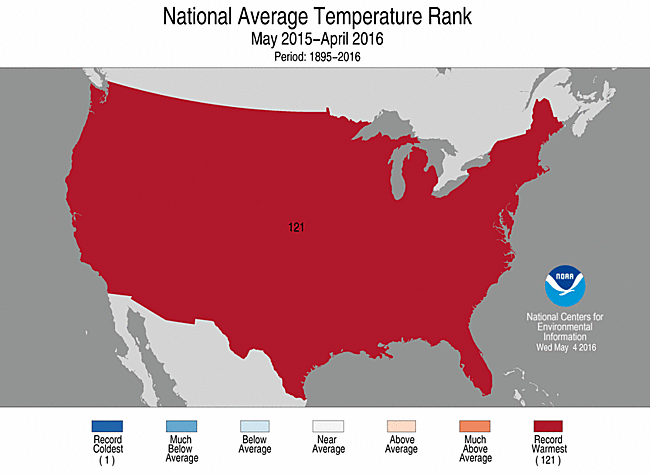
nationaltavgrank-201505-201604.gif

http://www.ncdc.noaa.gov/monitoring...altavgrank/nationaltavgrank-201505-201604.gif

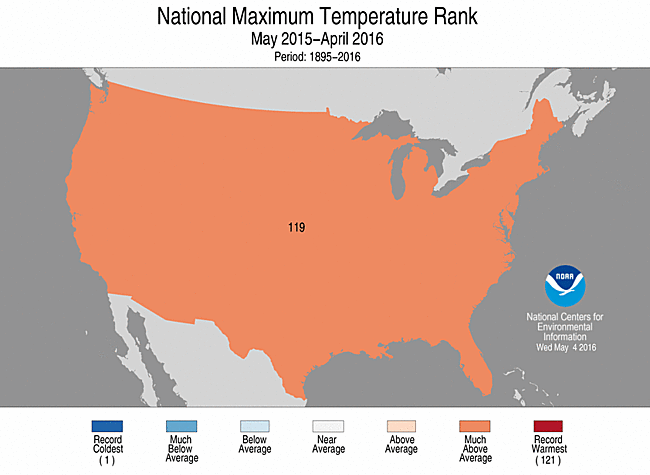
nationaltmaxrank-201505-201604.gif


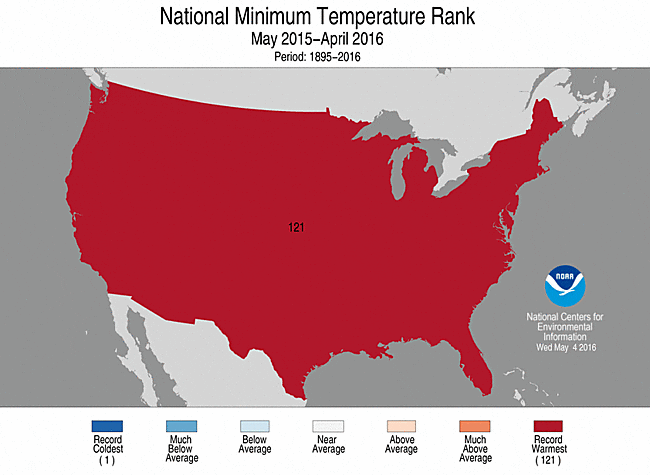
nationaltminrank-201505-201604.gif

nationalpcpnrank-201505-201604.gif

National Temperature and Precipitation Maps | Temperature, Precipitation, and Drought | National Centers for Environmental Information (NCEI)

Really funny. I am sure the people that have been flooded, and had their homes burned find it so damned humorous.
 
These Ranking charts are crap. I'm in Washington state and up until last week, we've been hot & dry while the rest of the nation has been cold & wet. Anyone want to explain to me how in the heck we & the rest of the country have traded weather????
 

You know, the government has been claiming for years that the past year was the "hottest ever". I wonder what they will be able to post in 20 years when us commoners don't see the difference?

Mark
 

You know, the government has been claiming for years that the past year was the "hottest ever". I wonder what they will be able to post in 20 years when us commoners don't see the difference?

Mark
And you are a liar. So give a government site that claims each of the past 20 years was the hottest year ever in the year following.

Really stupid bastards like you must get it off showing off your stupidity. The past year was clearly the hottest ever. 2014 was a very hot year, right up there with 1998, 2005, and 2010. Given the temperatures of the first four months of 2016, this year may rank right up there with 2015.
 

Truly don't understand those charts. Maybe they entertained you -- but they don't serve a purpose other than influencing folks that don't have a brain. There is no SPATIAL information or regional information in those statistics. So the only reason to show a national map is to MISLEAD FOLKS to believe that's the way it was all over the US..

When you see that crap ----- RUN !!!! Don't cut and paste it to impress others.
 

You know, the government has been claiming for years that the past year was the "hottest ever". I wonder what they will be able to post in 20 years when us commoners don't see the difference?

Mark
And you are a liar. So give a government site that claims each of the past 20 years was the hottest year ever in the year following.

Really stupid bastards like you must get it off showing off your stupidity. The past year was clearly the hottest ever. 2014 was a very hot year, right up there with 1998, 2005, and 2010. Given the temperatures of the first four months of 2016, this year may rank right up there with 2015.

Nope.,. Only if you totally dismiss BOTH the satellite records. By those measurements -- Which used to agree PERFECTLY with the land records before NOAA turned up the heat --- 2015 was third.

Now -- because El Nino PEAKED towards the end of 2015 and extended into 2016 -- this year might be better than 3rd..
 

Truly don't understand those charts. Maybe they entertained you -- but they don't serve a purpose other than influencing folks that don't have a brain. There is no SPATIAL information or regional information in those statistics. So the only reason to show a national map is to MISLEAD FOLKS to believe that's the way it was all over the US..

When you see that crap ----- RUN !!!! Don't cut and paste it to impress others.
LOL.


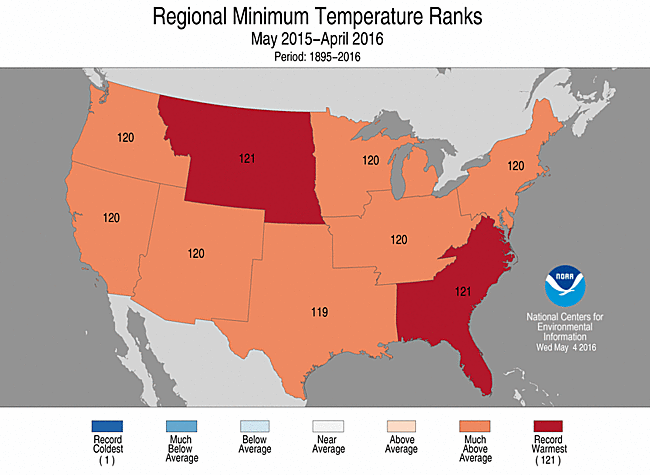
regionaltminrank-201505-201604.gif


statewidetavgrank-201505-201604.gif


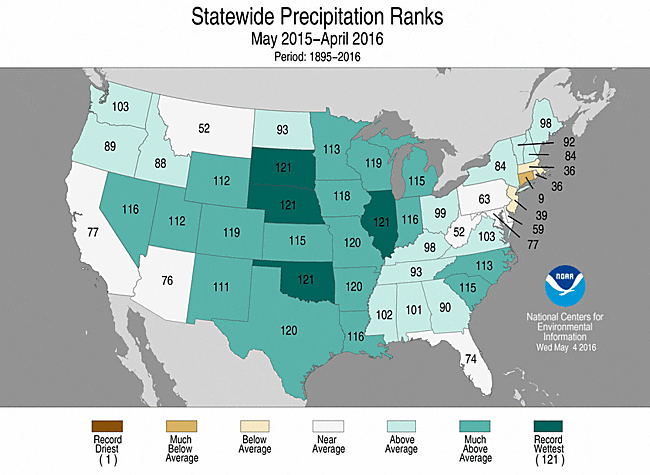
statewidepcpnrank-201505-201604.gif

http://www.ncdc.noaa.gov/monitoring...etavgrank/statewidetavgrank-201505-201604.gif


Not much better -- what is "much above average"? And if those go back into 2015 -- what's the big deal anyways. A yearly average doesn't really describe much about "climate". Especially during an El Nino.

And the SPAN of the time covered is centered DIRECTLY OVER the peak of the El Nino. More cheerful colors for the panicked.
 
And how many of the warmest years on record have we had since 1998?


The AGW cult I swear have like 50 darts and throwing it at a dart board...if one sticks they say "see its a trend".


Quit thinking with your ass and how about start using your brain?


But there are two different types of people in life...........those who see the world as it is and those who spend their lives wishing for a world that isn't. Its that simple.

This idea of yearning for a cessation of forest fires and floods is not grounded in any kind of real world. Been happening for billions ( that's with a B ) of years and I suspect probably billions of more years.

Some people cant get through the day without a tragic view of the world...........it is what it is. 100% certainty there isn't anything humans can do to eliminate tragedy from peoples lives. You can write it down.:2up:
 
PS....for the curious checking into this thread, the "pause" is a scientific fact acknowledged by branches of the United States Government.

Nobody but nobody knows whats going to happen moving forward............there are 4 billion theories. We have waaaaaaaaaaaaaaaaaaaaaaaaaaaaaaaaaaaaaaaaaaay too much still to learn about the climate. And the k00ks know it too!!!


NASA data shows that the ‘pause’ in global warming continues

http://www.economist.com/news/scien...ng-temperatures-over-past-15-years-goes-being
 

Forum List

Back
Top