Old Rocks
Diamond Member
- Thread starter
- #41

Arctic Sea Ice News and Analysis Sea ice data updated daily with one-day lag
Still running below two sigma.
Follow along with the video below to see how to install our site as a web app on your home screen.

Note: This feature currently requires accessing the site using the built-in Safari browser.
Arctic Sea Ice News and Analysis Sea ice data updated daily with one-day lag
Still running below two sigma.
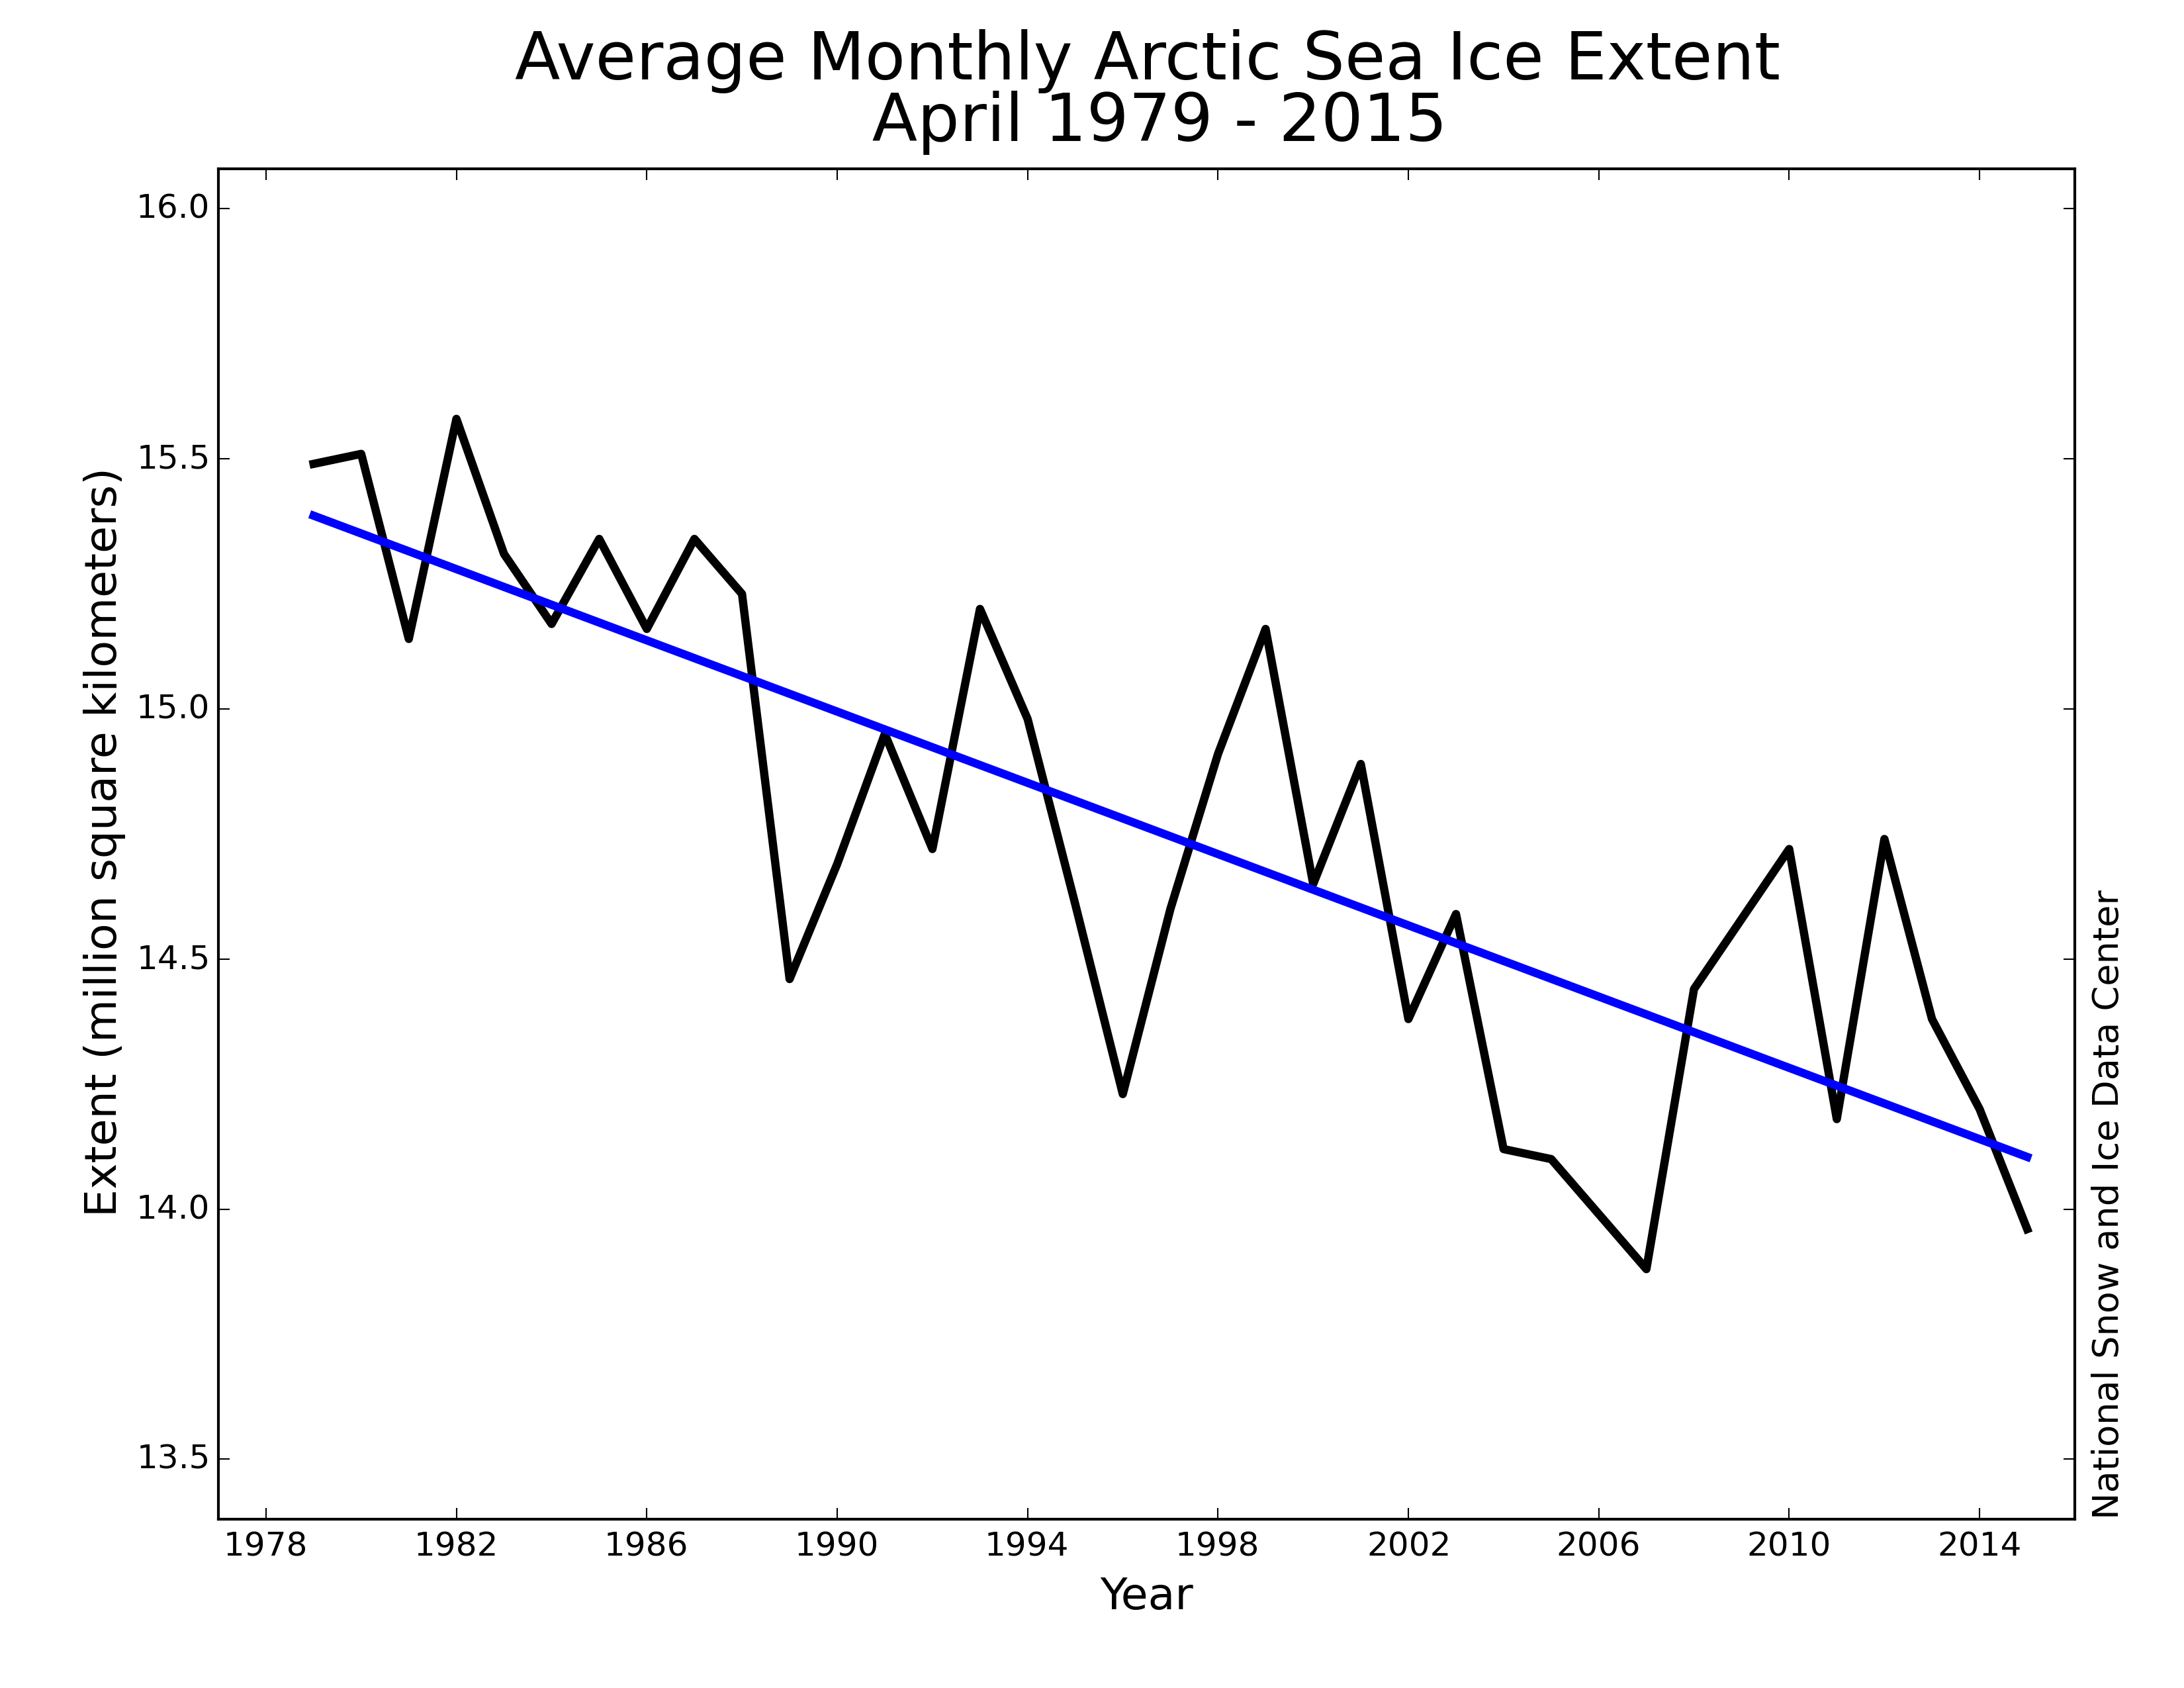
credit Climate Science.comApril 2015 compared to previous years
Figure 3. Monthly April ice extent for 1979 to 2015 shows a decline of 2.4% per decade relative to the 1981 to 2010 average.
Credit: National Snow and Ice Data Center
Looks like the decline is continuing.
Evidence Of Thicker Spring Sea Ice In Arctic
"11.05.2015 09:18 Age: 22 days
Direct measurements of sea ice thickness by satellite confirm computer model analysis in suggesting Spring sea ice volumes in the Arctic have to some extent recovered from their record low"
one more from ClimateScience.com;

Fig.1 Arctic sea ice volume anomaly from PIOMAS updated once a month. Daily Sea Ice volume anomalies for each day are computed relative to the 1979 to 2014 average for that day of the year. Tickmarks on time axis refer to 1st day of year. The trend for the period 1979- present is shown in blue. Shaded areas show one and two standard deviations from the trend. Error bars indicate the uncertainty of the monthly anomaly plotted once per year.
Polar Science Center PIOMAS Arctic Sea Ice Volume Reanalysis
The 'recovery' is well within the range of normal variability. The slope of that line is not normal variability. When there is enough recovery that the slope of that line is in the other direction, then there will be something to celebrate.
one more from ClimateScience.com;
Why does Old Rocks chart have the ice shrinking?
I wish I had an answer. I do so like how he and his ilks love to tell me I never present any material, and when I do most likely contradicts their data. But this graph does appear to show normal ice for the last seven to eight years anyway. BTW, they never claimed it was fully recovered.one more from ClimateScience.com;
Why does Old Rocks chart have the ice shrinking?
and is in line with the graphs I posted. This one has a really telling uptick.
Fig.1 Arctic sea ice volume anomaly from PIOMAS updated once a month. Daily Sea Ice volume anomalies for each day are computed relative to the 1979 to 2014 average for that day of the year. Tickmarks on time axis refer to 1st day of year. The trend for the period 1979- present is shown in blue. Shaded areas show one and two standard deviations from the trend. Error bars indicate the uncertainty of the monthly anomaly plotted once per year.
Polar Science Center PIOMAS Arctic Sea Ice Volume Reanalysis
The 'recovery' is well within the range of normal variability. The slope of that line is not normal variability. When there is enough recovery that the slope of that line is in the other direction, then there will be something to celebrate.
Now that it is inconvenient you believe in NATURAL VARIATION? Oh and the upward (ice increase) trend for the last 4 years, why are you ignoring it?
Natural variation is the normal ups and downs. When those normal ups and downs are imposed on a long term graph that is all down, or up, then the slope is not natural. I know that considering something other than simple black and white is beyond your ken, but most can understant that.

dude, again arctic ice extent ClimateScience.comand is in line with the graphs I posted. This one has a really telling uptick.
Fig.1 Arctic sea ice volume anomaly from PIOMAS updated once a month. Daily Sea Ice volume anomalies for each day are computed relative to the 1979 to 2014 average for that day of the year. Tickmarks on time axis refer to 1st day of year. The trend for the period 1979- present is shown in blue. Shaded areas show one and two standard deviations from the trend. Error bars indicate the uncertainty of the monthly anomaly plotted once per year.
Polar Science Center PIOMAS Arctic Sea Ice Volume Reanalysis
The 'recovery' is well within the range of normal variability. The slope of that line is not normal variability. When there is enough recovery that the slope of that line is in the other direction, then there will be something to celebrate.
Now that it is inconvenient you believe in NATURAL VARIATION? Oh and the upward (ice increase) trend for the last 4 years, why are you ignoring it?
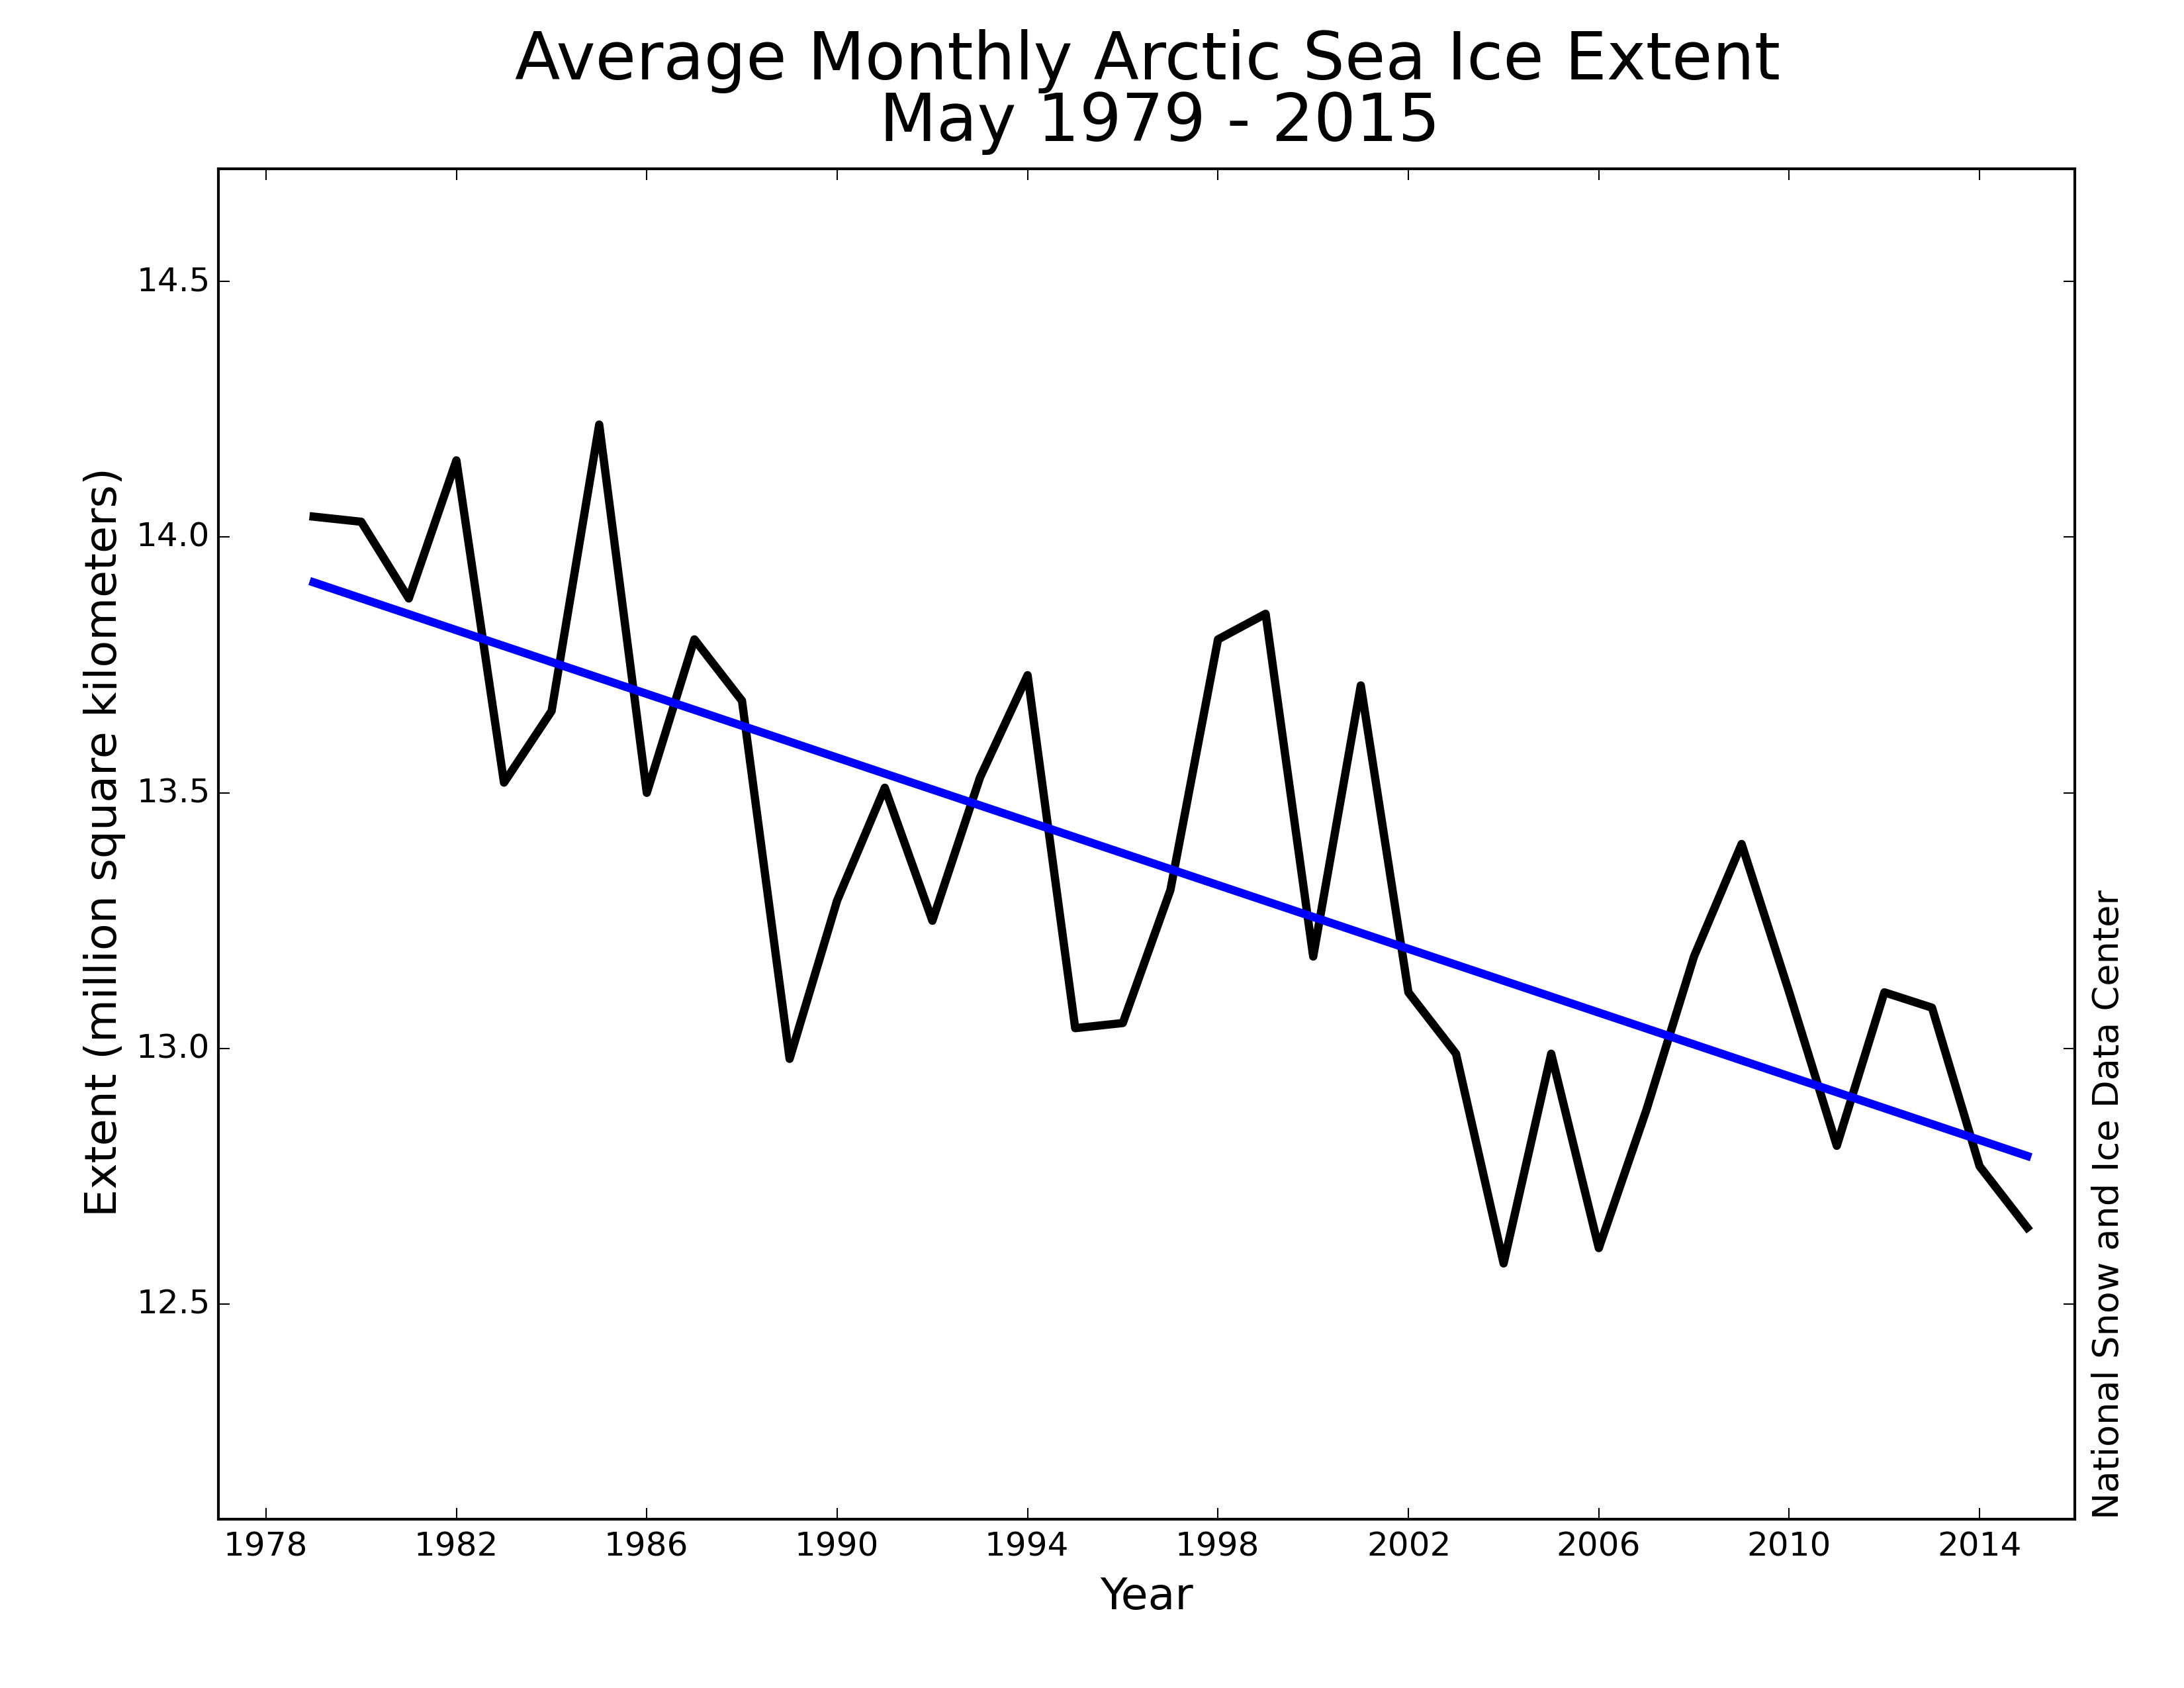
May 2015 compared to previous years
Figure 3. Monthly May ice extent for 1979 to 2015 shows a decline of 2.33% per decade relative to the 1981 to 2010 average.
Arctic Sea Ice News and Analysis Sea ice data updated daily with one-day lag
And this one a really telling downtick. And both are in the range of natural varibility, natural variability within a rapid decline.

Slurpee, give you a brain freeze, loved them.Arctic Ice was a sno-cone I used to eat when I was a kid. I liked the blue one because you never saw any blue food. Probably they were all the same: sugar flavored.
dude, again arctic ice extent ClimateScience.comand is in line with the graphs I posted. This one has a really telling uptick.
Fig.1 Arctic sea ice volume anomaly from PIOMAS updated once a month. Daily Sea Ice volume anomalies for each day are computed relative to the 1979 to 2014 average for that day of the year. Tickmarks on time axis refer to 1st day of year. The trend for the period 1979- present is shown in blue. Shaded areas show one and two standard deviations from the trend. Error bars indicate the uncertainty of the monthly anomaly plotted once per year.
Polar Science Center PIOMAS Arctic Sea Ice Volume Reanalysis
The 'recovery' is well within the range of normal variability. The slope of that line is not normal variability. When there is enough recovery that the slope of that line is in the other direction, then there will be something to celebrate.
Now that it is inconvenient you believe in NATURAL VARIATION? Oh and the upward (ice increase) trend for the last 4 years, why are you ignoring it?
May 2015 compared to previous years
Figure 3. Monthly May ice extent for 1979 to 2015 shows a decline of 2.33% per decade relative to the 1981 to 2010 average.
Arctic Sea Ice News and Analysis Sea ice data updated daily with one-day lag
And this one a really telling downtick. And both are in the range of natural varibility, natural variability within a rapid decline.
Your graph doesn't agree with this one.
Hmm, the titles stated recovery! Hmmmdude, again arctic ice extent ClimateScience.comand is in line with the graphs I posted. This one has a really telling uptick.
Fig.1 Arctic sea ice volume anomaly from PIOMAS updated once a month. Daily Sea Ice volume anomalies for each day are computed relative to the 1979 to 2014 average for that day of the year. Tickmarks on time axis refer to 1st day of year. The trend for the period 1979- present is shown in blue. Shaded areas show one and two standard deviations from the trend. Error bars indicate the uncertainty of the monthly anomaly plotted once per year.
Polar Science Center PIOMAS Arctic Sea Ice Volume Reanalysis
The 'recovery' is well within the range of normal variability. The slope of that line is not normal variability. When there is enough recovery that the slope of that line is in the other direction, then there will be something to celebrate.
Now that it is inconvenient you believe in NATURAL VARIATION? Oh and the upward (ice increase) trend for the last 4 years, why are you ignoring it?
May 2015 compared to previous years
Figure 3. Monthly May ice extent for 1979 to 2015 shows a decline of 2.33% per decade relative to the 1981 to 2010 average.
Arctic Sea Ice News and Analysis Sea ice data updated daily with one-day lag
And this one a really telling downtick. And both are in the range of natural varibility, natural variability within a rapid decline.
Your graph doesn't agree with this one.
Did you think that any of these graphs show Arctic ice extents stable or recovering?