Old Rocks
Diamond Member
April 2015 compared to previous years
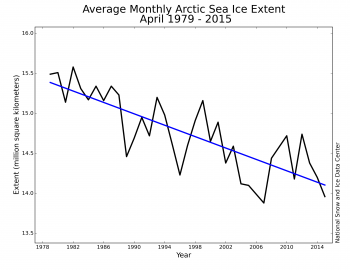
Figure 3. Monthly April ice extent for 1979 to 2015 shows a decline of 2.4% per decade relative to the 1981 to 2010 average.
Credit: National Snow and Ice Data Center
Looks like the decline is continuing.
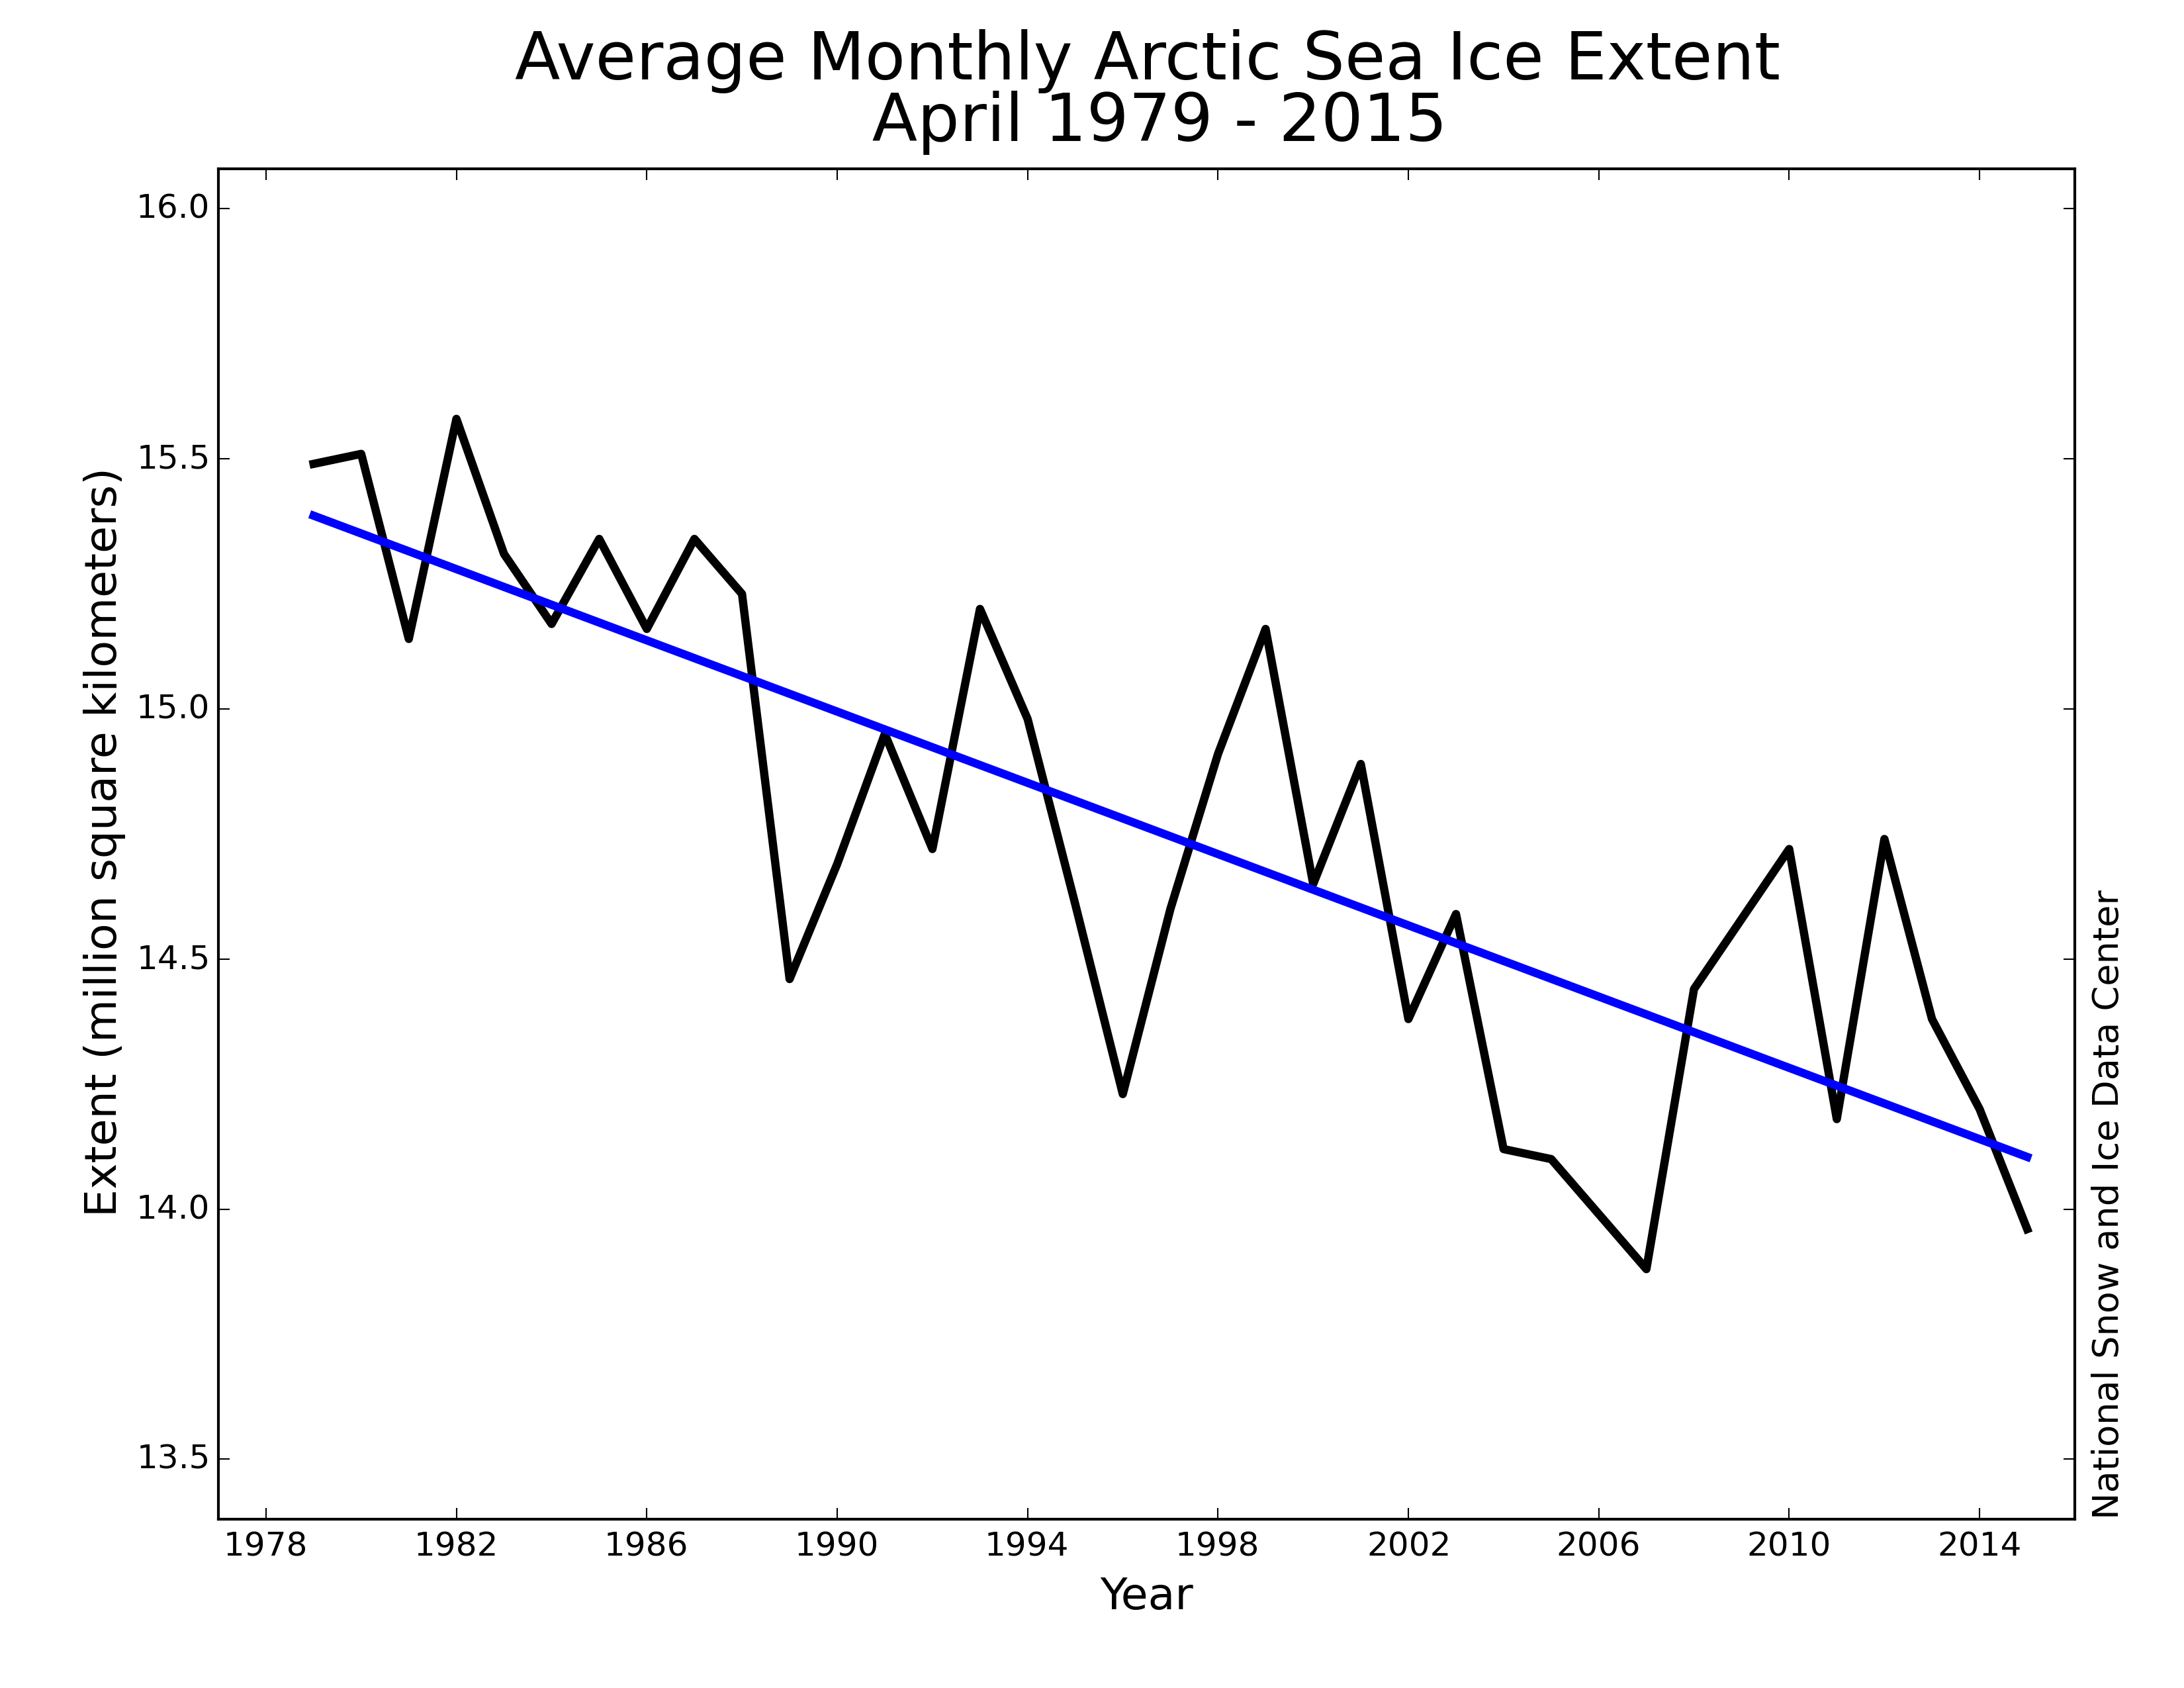
Figure 3. Monthly April ice extent for 1979 to 2015 shows a decline of 2.4% per decade relative to the 1981 to 2010 average.
Credit: National Snow and Ice Data Center
Looks like the decline is continuing.