What do you make of this?
I dunno, what do you make of it?
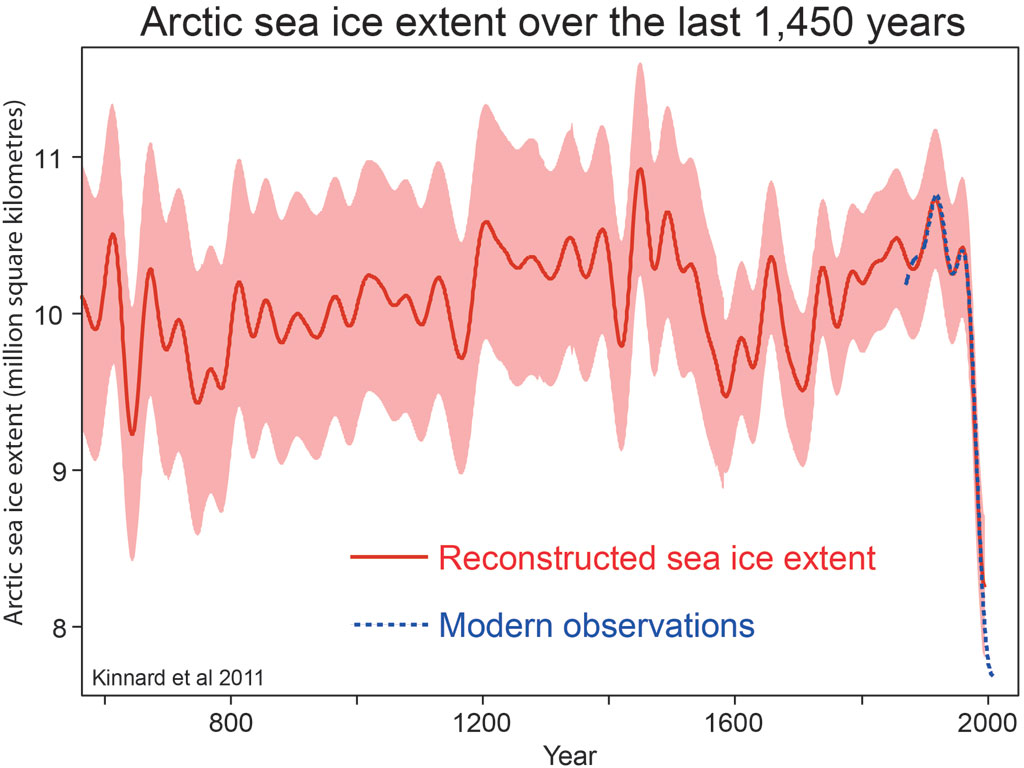
first off, it seems odd that the Little Ice Age would have low arctic sea ice, rising to a max around 1900. does that match up with historical documentation?

Follow along with the video below to see how to install our site as a web app on your home screen.
Note: This feature may not be available in some browsers.
What do you make of this?
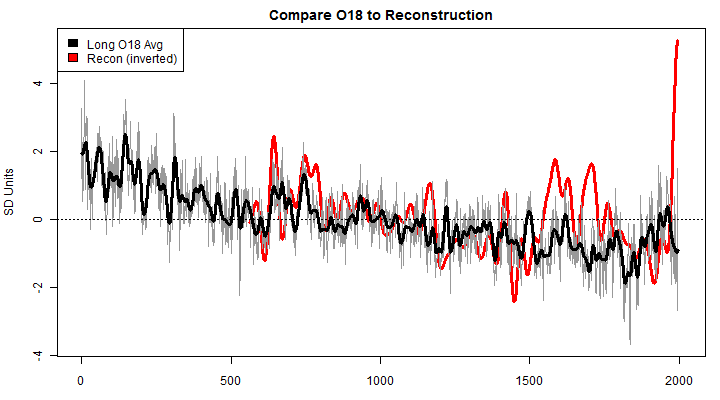
s noted in the preview, this means that the derivation of the Kinnard hockey stick must come from elsewhere: either from the other ice core proxies (Na+, melt, MSA), from the D’Arrigo tree rings or from the other proxies (a few sediments and documentary series) or from regression procedures. If so, one needs to check out which series have been heavily weighted and whether series have been flipped through the regression methods. Splicing is also something that needs to be looked at: for example, while the O18 series from the Eastern Islands don’t permit a direct medieval-modern comparison, has their stepwise introduction introduced a medieval-modern differential that does not exist in the long series?
Whatever the results of this analysis may be, Kinnard et al deserve credit for ensuring this remarkable expansion of the public archive of Arctic O18 series.
Here is the complete transposition (as archived. It’s possible that it’s an archiving error rather than a substantive error):
Tornetrask – relocated to Central Northwest Territories;
Forgfjorddalen, Norway – relocated to Yakutia, Siberia
Central Northwest Territories, Canada – relocated to Taymir, Siberia
Yakutia, Siberia – relocated to Polar Urals, west Siberia
Taymir, Siberia – relocated to Yukon, Canada
Yamal, Siberia – relocated to Tornetrask, Sweden
Yukon, Canada – relocated to Forgfjorddalen, Norway
If the error in their archive exists in their data as used, these erroneous locations will obviously affect spatial maps of loadings and weights, to the extent that these proxies are used. This sort of error should have been observable almost immediately to anyone familiar with the proxies.
Over and above the transposition error, Kinnard et al have incorrectly used the Yamal chronology as the “Polar Urals” chronology (with Polar Urals core counts). In fairness to Kinnard et al, D’Arrigo et al incorrectly labeled the Yamal chronology as Polar Urals and then refused to issue a Corrigendum acknowledging the error.
At first I was suspicious that the recent fast drop in ice came from "modern observations". The two different methods might not jibe in reality. But I saw that Kinnard's results did closely overlap the modern observations. That gives credibility to the earlier history that Kinnard showed.I dunno, what do you make of it?
first off, it seems odd that the Little Ice Age would have low arctic sea ice, rising to a max around 1900. does that match up with historical documentation?
I usually don't give credibility to analyses from blogs, but that's the only references I could find that discuss Kinnard.more on the tree ring proxies- Kinnard and the D Arrigo-Wilson Chronologies Climate Audit
as usual peer review fails miserably to catch even obvious mistakes.
jc, I reported that for spamming and trolling. That was just the last straw. You've been breaking board rules constantly. Stop it. The "No trolling" rule means that if you have nothing to say, don't say it.
Now, let's look at today's update.
Arctic ice, a bit more below the 2-sigma line.
Above-freezing temperatures continue over the polar regions north of Alaska. Forecast is they'll spread over most of the Arctic ocean this week.
So, lots of melt ponds to keep absorbing that solar energy over the summer, meaning a big melt season.


I have serious doubts that the proxy records would pick up low ice extents like the present. Or even temperature spikes like the present. Proxy reconstructions have their uses but only give a general indication of what was going on. The recent fad of grafting instrumental data onto proxy data is unscientific at best and dishonest at worst.


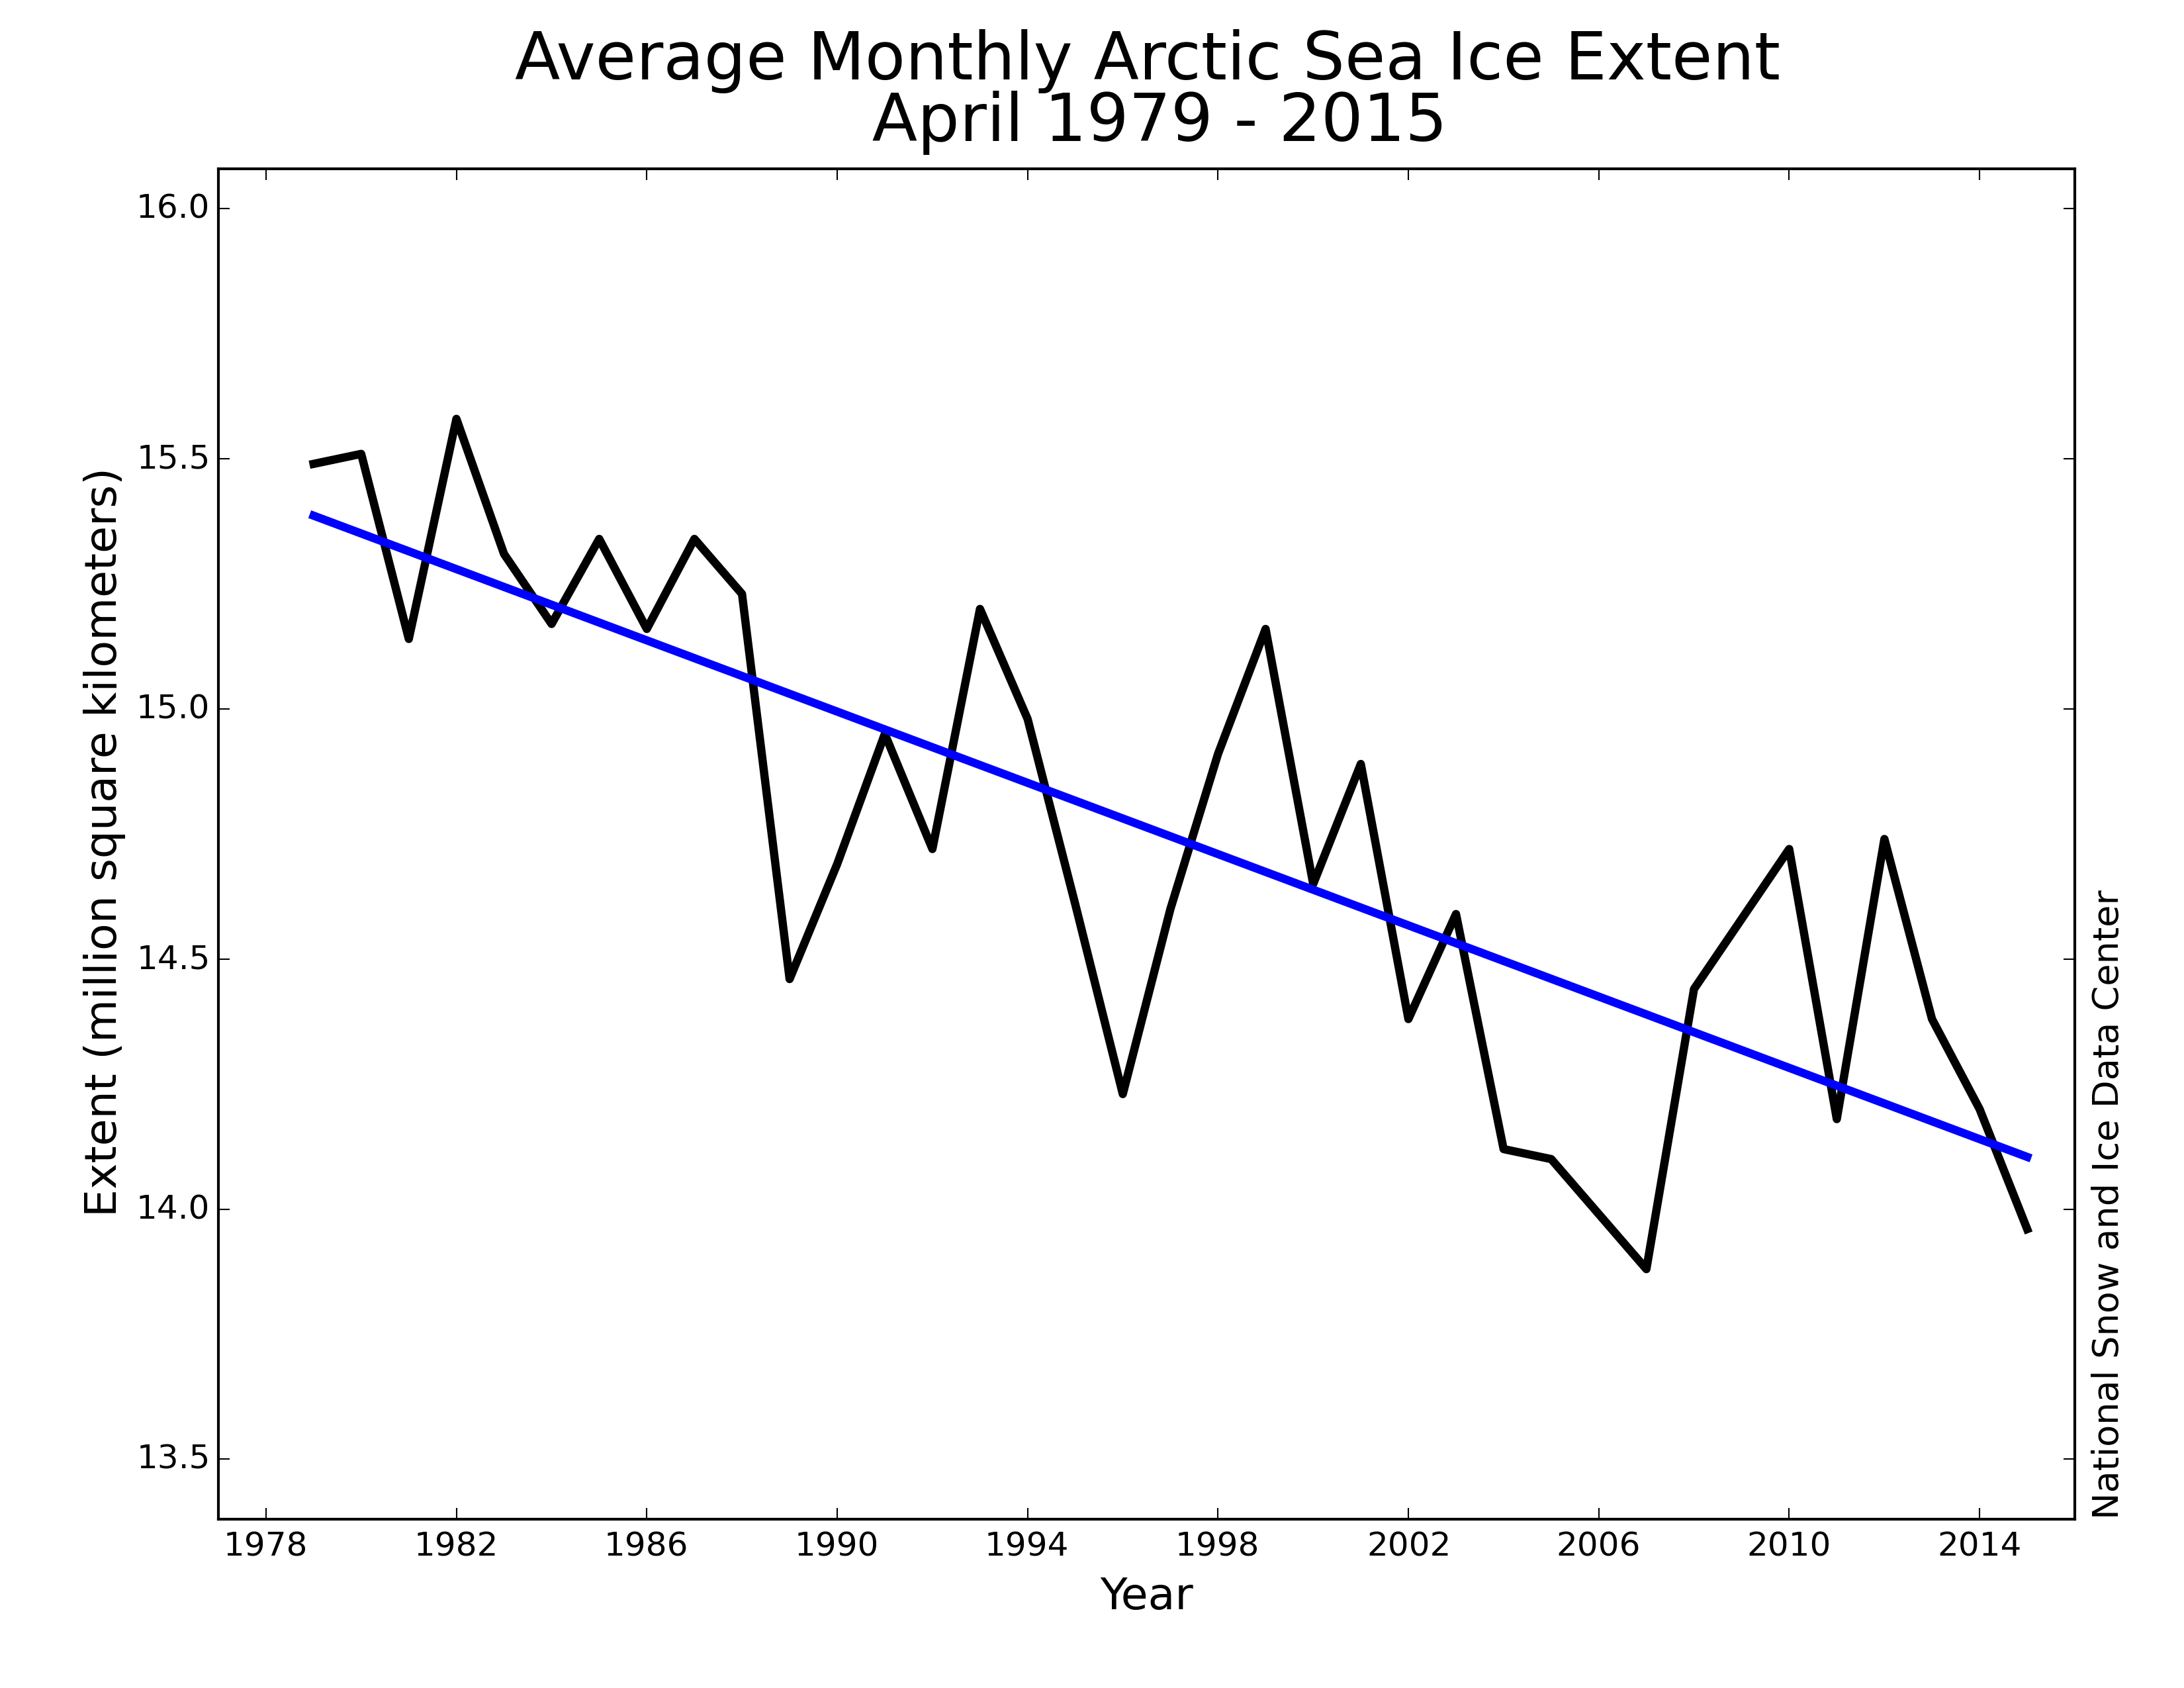
April 2015 compared to previous years
Figure 3. Monthly April ice extent for 1979 to 2015 shows a decline of 2.4% per decade relative to the 1981 to 2010 average.
Credit: National Snow and Ice Data Center
Looks like the decline is continuing.
Ice age warning in the '70's? By the scientific community? Care to show me? And Time or Newsweek are not scientific journals.

credit Climate Science.comApril 2015 compared to previous years
Figure 3. Monthly April ice extent for 1979 to 2015 shows a decline of 2.4% per decade relative to the 1981 to 2010 average.
Credit: National Snow and Ice Data Center
Looks like the decline is continuing.