OODA_Loop
Account Terminated
Oh well...Obama is going to win. Win easily and you'll just have to sit here and take it.
New poll shows Obama leads Romney in swing states | The Ticket - Yahoo! News

Follow along with the video below to see how to install our site as a web app on your home screen.
Note: This feature may not be available in some browsers.
Oh well...Obama is going to win. Win easily and you'll just have to sit here and take it.
It was a mixture of both parties out of control spending and pandering that caused the situation we are in, however this administration has doubled down on its spending and tightened the noose around the neck of the economy and is strangling it to death.
You can only blame the other guy for so long before you have to accept responsibility for your own actions. That time has come to pass.

Now what?
Now what?
Link? Dates graph was compiled? What exactly does the graph include?
I can draw a purdy little graph too and make it look however I want it to look and use fancy words to make it seem authentic. Without a link and data to break it down it is useless.
It's quite obvious that the recording of Romney dumping on the entitlement crowd has seriously backfired on Democrats... They honestly believe that it was a negative, when in fact it reveals a person who isn't afraid to say what he believes in, and that's a positive. Anyone with the slightest bit of common sense knows that Mitt Romney was referring to the people who will back Obama simply because they believe that either their entitlements will remain in order, or that their racially motivated vote (based solely upon Obama's skin color) will offer them something in return. There are far more people working who are completely disgusted that they have been lined up under Obama to subsidize people who simply want to be cared for, and don't have the motivation to ante up for themselves. Obama eliminating Bill Clinton's work requirement on Welfare comes to mind. Electing Mitt Romney wont completely satisfy me Politically because there are several aspects of his politics I tend to disagree with... But given the two choices... My wallet, and my beliefs cannot afford four more years of Barry Soetoro... Mitt gets my Vote.
So, Mitt gets your Vote. After he expressed that he loathes people like you.
What Mitt needs to know, that the American people already do know.
Who are the 47%?
Federal budget and Census data show that, in 2010, 91 percent of the benefit dollars from entitlement and other mandatory programs went to the elderly (people 65 and over), the seriously disabled, and members of working households. People who are neither elderly nor disabled and do not live in a working household received only 9 percent of the benefits.
Moreover, the vast bulk of that 9 percent goes for medical care, unemployment insurance benefits (which individuals must have a significant work history to receive), Social Security survivor benefits for the children and spouses of deceased workers, and Social Security benefits for retirees between ages 62 and 64. Seven out of the 9 percentage points go for one of these four purposes.
80 percent of the workforce has seen their wages decline in real terms over the last quarter-century, and the average household has seen 40 percent of its wealth disappear during the Great Recession. Through it all, families never asked for a handout from anyone, especially Washington. They were left to go on their own, working harder, squeezing nickels, and taking care of themselves. But their economic boats have been taking on water for years, and now the crisis has swamped millions of middle class families.
OK, time for the Maobama-bot-zombies to shit themselves, of course we know they will use the shit hole on their face.
If conservatives think that a few, certain polls show that Romney is going to win and they believe it, they should go to Intrade and bet on it because Romney has been dropping like a stone. The Romney contract is at 30 cents, a screaming bargain if you think Romney is going to win.
President Obama 247 Governor Romney 191
RealClearPolitics - 2012 Election Maps - Electoral Map
Ohio President Obama 4.8
Virginia President Obama 4.7
Florida President Obama 2.1


By the end of Wednesday, however, it was clear that the preponderance of the evidence favored Mr. Obama. He got strong polls in Ohio, Florida, Michigan, Wisconsin and Virginia, all from credible pollsters. Mr. Obama, who had been slipping in our forecast recently, rebounded to a 75.2 percent chance of winning the Electoral College, up from 72.9 percent on Tuesday.
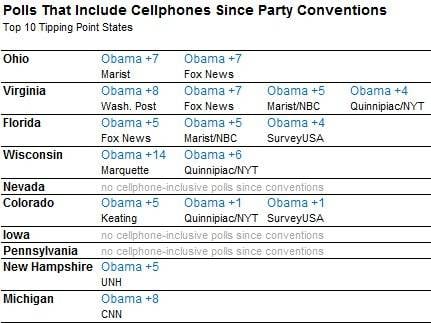
The most unambiguously bearish sign for Mr. Romney are the poor polls he has been getting in swing states from pollsters that use a thorough methodology and include cellphones in their samples.
There have been 16 such polls published in the top 10 tipping point states since the Democratic convention ended, all conducted among likely voters. Mr. Obama has held the lead in all 16 of these polls. With the exception of two polls in Colorado where Mr. Obamas polling has been quite middling recently all put him ahead by at least four points. On average, he led by 5.8 percentage points between these 16 surveys.
If conservatives think that a few, certain polls show that Romney is going to win and they believe it, they should go to Intrade and bet on it because Romney has been dropping like a stone. The Romney contract is at 30 cents, a screaming bargain if you think Romney is going to win.
Site? I'd buy that stock.
If conservatives think that a few, certain polls show that Romney is going to win and they believe it, they should go to Intrade and bet on it because Romney has been dropping like a stone. The Romney contract is at 30 cents, a screaming bargain if you think Romney is going to win.
Now what?
Now what?
Link? Dates graph was compiled? What exactly does the graph include?
I can draw a purdy little graph too and make it look however I want it to look and use fancy words to make it seem authentic. Without a link and data to break it down it is useless.
Economist's View: Per Capita Government Spending by President
You are quoting some unknown poster on a message board who doesnt reveal his calculations, doesnt include TARP or any of the stimulus spending, or ARRA spending?
Are you serious?


Rasmussen Reports has released today, three key polls that show Mitt Romney's likely win in this year's presidential election over President Obama. The Rasmussen Reports Presidential Daily Tracking Poll released today shows Romney leading 47 percent to 46 percent over Obama. Rasmussen's Daily Swing State Tracking Poll of 11 key swing states won by President Obama in 2008 shows Romney leading them by the exact same percentages. The latest Rasmussen poll of New Hampshire released today shows Romney leading there 48 percent to 45 percent.
New Hampshire is a key swing state that could make a difference with its four electoral votes, and George W. Bush would have reached 270 electoral voters in 2000 without having won this state. New Hampshire had narrowly favored Obama in many polls over the last few months and while the analysis conduced here by this columnist has consistently predicted Mitt Romney will win the state (based in part on knowledge of local politics in the state having lived in New England for years), most projected have shaded New Hampshire blue and predicted it will go for Obama. This Rasmussen survey is key in that it likely shows movement in New Hampshire in the direction of Mitt Romney.
In the instance of an incumbent president who enjoys just about 100 percent name recognition and is seeking reelection, most of the undecided voters are likely to swing to the challenger by election day. This is especially true when the challenger remains still less known to the public than the incumbent, as is true with former Massachusetts Governor Mitt Romney. By election day, those other nine percent not favoring Romney or Obama in the Rasmussen Daily Tracking poll are likely include less than one percent voting for third party candidates and five or six percent of those nine will likely vote for Mitt Romney. That would indicate a popular vote win by Romney of about 53 percent to 46 percent, or the reverse of Obama's win in 2008. This would lead to an electoral college total of more than 300 electoral votes for Romney.
The 11 swing states tracked by Rasmussen in it's swing state tracking poll show Romney leading 47 percent to 46 percent, where some weeks ago the two candidates were tied at 45 percent in the Rasmussen tracking poll of these 11 key swing states. President Obama won these same states collectively by a 53 percent to 46 percent margin in 2008. Now he is seven percent behind that finish now in these states. Romney is likely to capture most of the undecided votes and could win these states collectively by at least a 52 percent to 47 percent margin. That would likely lead to Romney winning Colorado, Florida, Iowa, Nevada, New Hampshire, North Carolina, Ohio, Virginia and Wisconsin while having a competitive chance in Michigan and Pennsylvania.
If President Obama can only win Michigan and Pennsylvania among those 11 swing states, he can not be reelected to the presidency.
Mitt Romney likely win in presidential election shown by three key polls - Arlington Conservative | Examiner.com
