Antarctic sea ice 2016: Historic lows

For Nov. 27th JAXA has posted 12,318,519 km2 for SIE around Antarctica.

Down by 142,460 km2.

From NSIDC, the drop at Nov 26 was even bigger, -193K. The SIE isnow at 12,485 Mn km2 which is about a million km2 lower than 1986 at the moment.
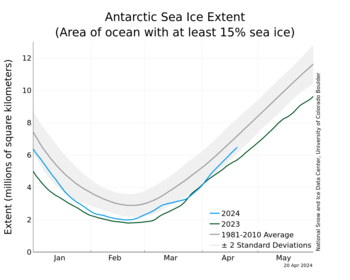
S_stddev_timeseries_thumb.png
lol

Still using failed data...NSIDC is not updated with corrected values yet.\

DMI has corrected the graphing:
icecover_current_new.png
 
Last edited:
Probably because emotional people who have abandoned all reason and logic are ruining this country.

And you think you have better reasoning abilities than everyone else? You've proven that false today. Any way, I'm putting you on ignore so I can go back to having useful conversations on this subject.
Better than you that's for sure.

Than making use of that superior reasoning power, I'm sure you can explain why you believe the radiative forcing factor of CO2 in the atmosphere is unable to initiate warming while that of "the sun and the oceans" are. Something better than "because they never have".

No.. You have this bass ackwards as usual. All those accelerations and feedbacks attributed to CO2 are NEVER applied when the forcing is primary solar variation. Apparently, the Earth knows the difference and suffers MORE when the forcing is from man-made CO2. That's why your IPCC conveniently ignores the magic multipliers and crap when dismissing solar forcing..

That would be the forcing from THIS:

Changes_in_total_solar_irradiance_and_monthly_sunspot_numbers,_1975-2013.png


Astounding how well that correlates with global temperature. And what's the range of forcing up there? >0.25W/m^2. Man, that's a scorcher!

Too funny:

Crick misses the magnetic waves and changes in wave lengths which affect earths temp far more than TOTAL SOLAR OUTPUT.. But then straw men is all Crick and the IPCC have..
 
Antarctic sea ice 2016: Historic lows
Mark BrandonNovember 24, 2016Leave a reply
Antarctic sea ice 2016: Historic lows
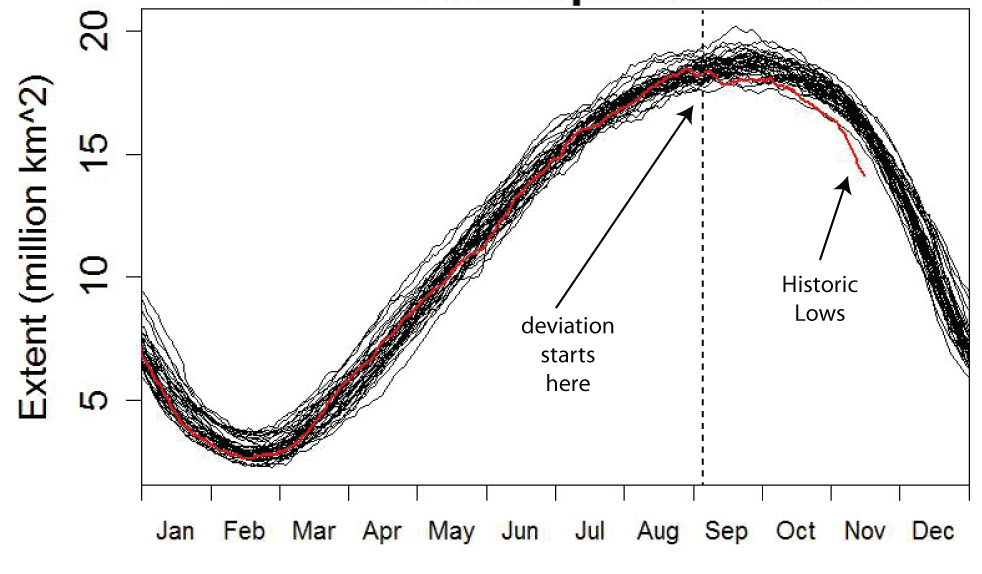
The seasonal cycle of sea ice extent in Antarctica has been fairly stable over the length of the satellite record. There is a slow growth of sea ice from a minimum of ~3x10⁶ km2 in February to a maximum of ~19 x106km2 in September in February before a relatively rapid fall in the Antarctic spring.

But this year something different is going on.

Below is Tamino's image for the Southern Hemisphere, the red line is 2016 up to 16 November 2016.

SHM_Annotated.gif

The annotated seasonal extent of sea ice in the Southern hemisphere. From Tamino's post Sea Ice, North and South.
From January up to September the sea ice extent follows all previous data.

But what happened in September?


After that date it dipped low, to reach historic lows by the end of October.

Well, there goes Antarctica argument the loserterians had.
I can read a graph....and it's obvious that it's not even close to historic lows.
 
Antarctic sea ice 2016: Historic lows
Mark BrandonNovember 24, 2016Leave a reply
Antarctic sea ice 2016: Historic lows
The seasonal cycle of sea ice extent in Antarctica has been fairly stable over the length of the satellite record. There is a slow growth of sea ice from a minimum of ~3x10⁶ km2 in February to a maximum of ~19 x106km2 in September in February before a relatively rapid fall in the Antarctic spring.

But this year something different is going on.

Below is Tamino's image for the Southern Hemisphere, the red line is 2016 up to 16 November 2016.

SHM_Annotated.gif

The annotated seasonal extent of sea ice in the Southern hemisphere. From Tamino's post Sea Ice, North and South.
From January up to September the sea ice extent follows all previous data.

But what happened in September?


After that date it dipped low, to reach historic lows by the end of October.

Well, there goes Antarctica argument the loserterians had.
View attachment 99754
Notice how they already have December's readings on this graph, yet it's still only November.
 
CO2 does not drive climate change!!!!!!!!!!!!!!!!!!!!!!

Say it enough times and it might come true. And all the physicists in the world will stand amazed. Publish why this is so and win a Nobel.
Or receive numerous death-threats.
 
For Nov. 27th JAXA has posted 12,318,519 km2 for SIE around Antarctica.

Down by 142,460 km2.

From NSIDC, the drop at Nov 26 was even bigger, -193K. The SIE isnow at 12,485 Mn km2 which is about a million km2 lower than 1986 at the moment.

S_stddev_timeseries_thumb.png
lol

Still using failed data...NSIDC is not updated with corrected values yet.\

DMI has corrected the graphing:
icecover_current_new.png
LOL

N_stddev_timeseries_thumb.png


N_daily_extent_dthumb.png


S_stddev_timeseries_thumb.png


S_daily_extent_dthumb.png


Arctic Sea Ice News and Analysis | Sea ice data updated daily with one-day lag

Poor Silly Billy strikes out again.
 
So you think there's a buffer somewhere, that nobody knows about, with greater than 30 year's capacity in it.

No ME and the climate scientists KNOW there is a big buffer. YOU should also. Since you've posted this 90% of the GW goes into the oceans business. You just don't THINK. You don't engage your brain and ponder before your fingers start typing. And we've DONE THIS before too. Where Max Planck Inst, J Curry and several other top notch think tanks have laid out 100 years or more of LATENCY in achieving steady state warming in the climate. It's no secret Bullwinkle. It HOW IT WORKS..

And if you haven't noticed, there aren't many of those CO2 versus temperature graphs hitting USA today anymore because that Sesame Street version of climate science is just to silly to be pushing anymore. That's YOUR concept that all surface temp changes INSTANTANEOUSLY (in the climate sense of time). That's never been true. And you should stop looking for YEARLY or MONTHLY or even DECADALLY correlated effects of variables on the GMAST. Unless you're a cartoon character or something.
 
For Dec. 1st JAXA has posted 11,508,508 km2 for the SIE around Antarctica.

Down by 189,457 km2.

Melt momentum.
index.php


This is going to get really ugly if that ice keeps shattering in the top and top-left side of this imagine.
 
Last edited:
For Dec. 1st JAXA has posted 11,508,508 km2 for the SIE around Antarctica.

Down by 189,457 km2.

Melt momentum.
index.php


This is going to get really ugly if that ice keeps shattering in the top and top-left side of this imagine.
MSU%20UAH%20ArcticAndAntarctic%20MonthlyTempSince1979%20With37monthRunningAverage.gif
 

375 top scientists warn against Trump's plan to pull out of climate pact

On Tuesday, 375 top scientists signed an open letter warning against the consequences of backing out of the historic Paris Climate Agreement, which Republican presidential nominee Donald Trump has said he would do if elected.

The letter marks an unusual foray into presidential politics for most of these scientists, many of whom specialize in climate change-related fields. World-renowned theoretical physicist Stephen Hawking is among the signatories, as is former Obama energy secretary and Nobel Laureate Steven Chu.


The Paris Agreement, which is expected to go into force this year or in 2017, commits all nations to undertake steps to reduce greenhouse gas emissions and adapt to global warming impacts for the first time. At least 20 countries are expected to announce their ratification of the agreement in an event at the United Nations on Wednesday.

SEE ALSO: In diplomatic milestone, the US and China formally join Paris Climate Agreement

The list of scientists signing the letter includes 30 Nobel Laureates, and all signatories are members of the National Academy of Sciences (NAS).

375 scientists, 30 Nobel Laureates versus on senile old bat.

Good for them. So what?
 

Forum List

Back
Top