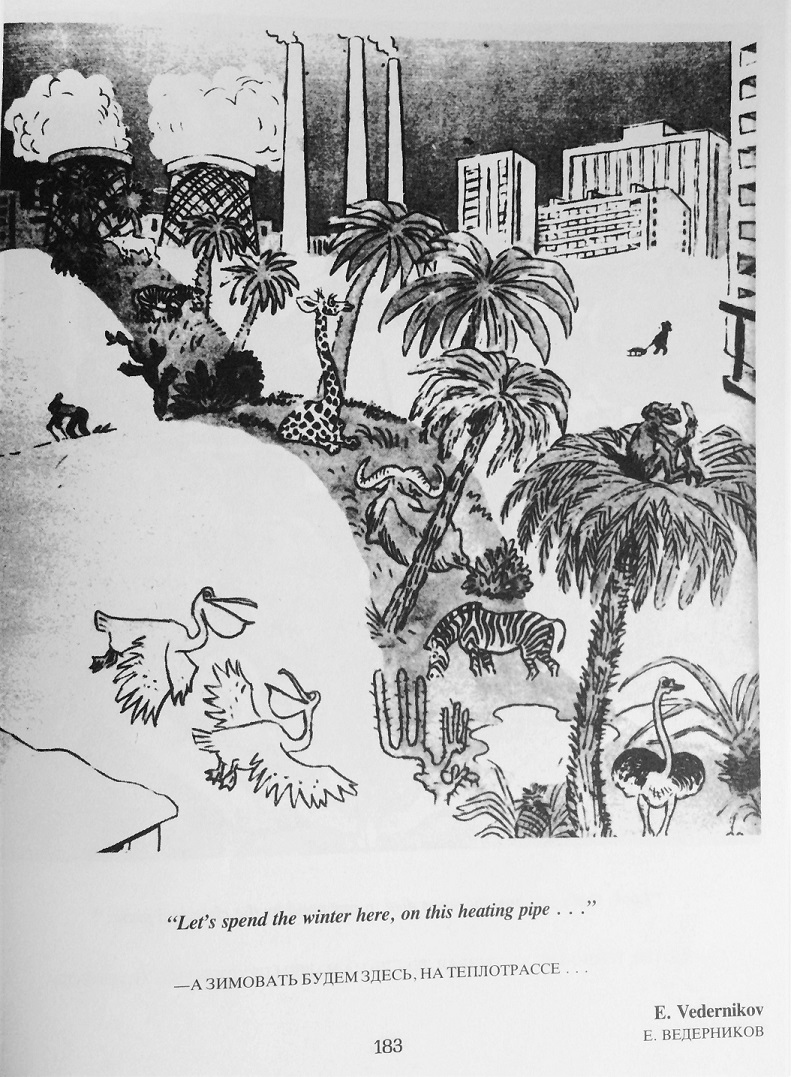
This is obviously a cartoon. I don't actually believe zebras are lining in Siberia.
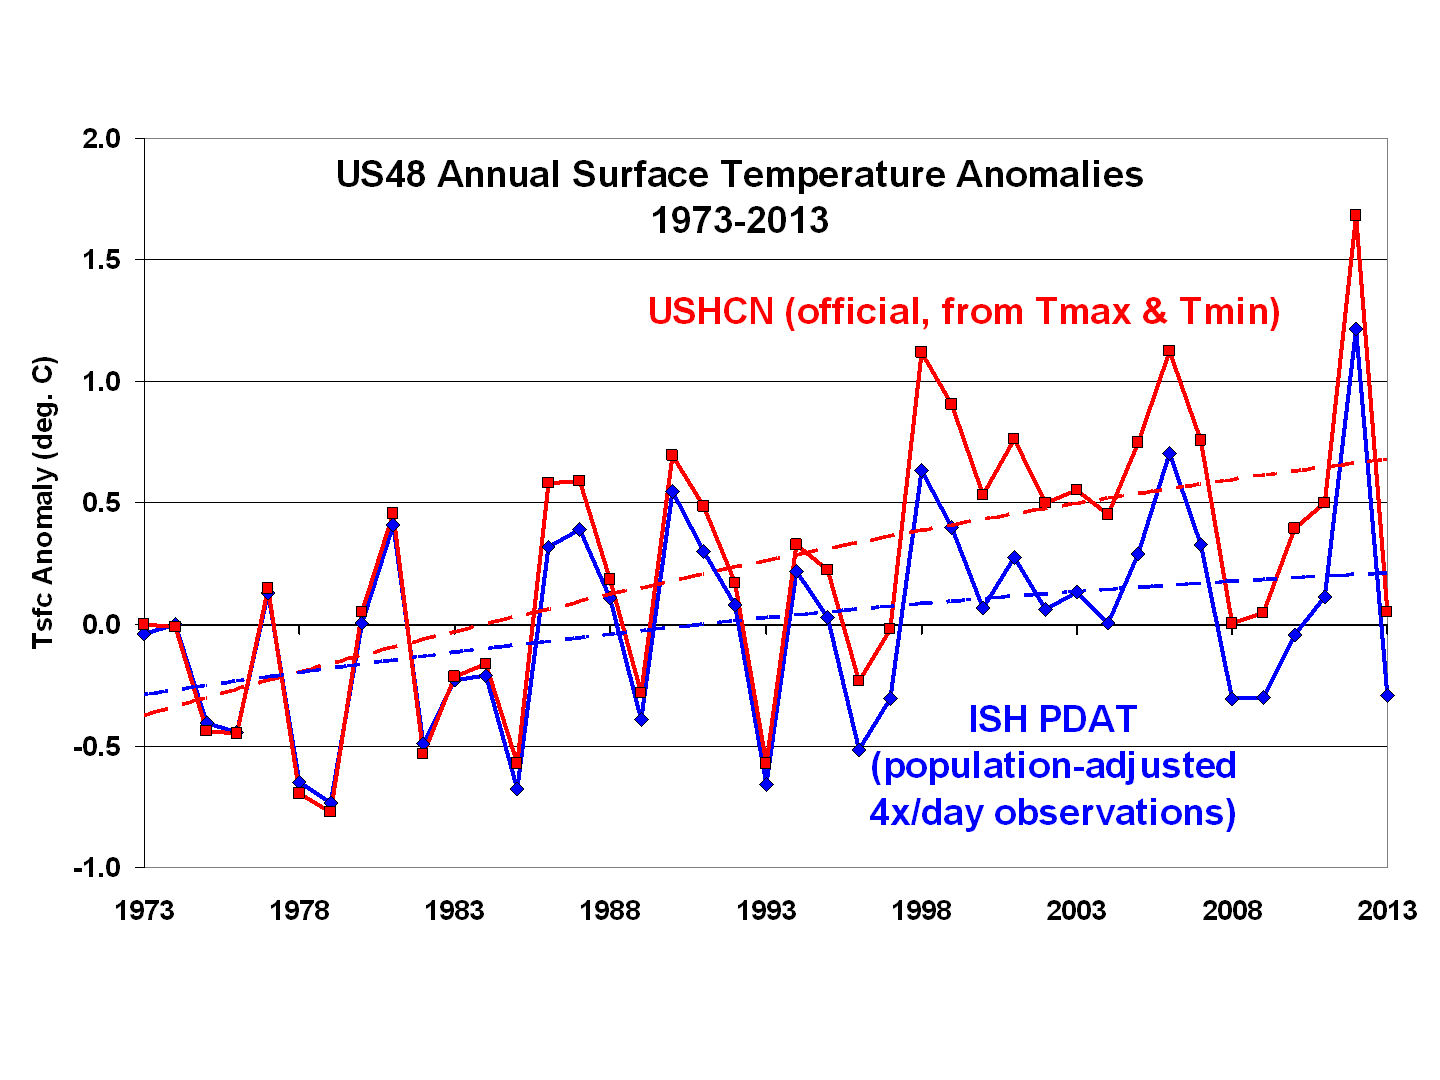
It does point out the problems of identifying warming trends in polar regions. Is Barrow Alaska really one of the fastest warming places on the globe, or does the actually measured UHI have something to do with it? Many northern stations are at airports. Does the propwash or jet exhaust from increased flights have anything to do with the rising trend, which has been increased by adjustments and homogenization rather than lowered.

 They are no longer there to hit...