Alarmist Adjustments of GISS/NOAA Data are fraud on the US Citizens..

Billy_Bob

Diamond Member
Sep 4, 2014
30,837
20,604
1,945
Top Of The Great Divide
Alarmist Adjustments of GISS/NOAA Data are fraud on the US Citizens..


With all the crap being spewn about by the alarmist of the hottest this or that I believe it is time to expose their lies and fraud of adjustments. Not one of the alarmists here has justified their unfaltering cult like belief of everything government has told them to believe.

Data homogenization; there are two types. the first is the altering of station data by grouping five or more stations and averaging them. The problem lies in the poor quality of the stations surrounding a high quality station which has its data altered to match the poor stations. this results in short term increased temp numbers which in long term alter the whole climate record. The second is using roaming 3, 4, 5 ,6, 10, 12, 15 year averages eliminating the yearly rises resulting in past temp record drops in temp and raising the near term temps. This creates huge errors of 3-5 degree C swings in the temperature records. Neither of these methods is scientific and both are agenda driven to "appear" like science.
screenhunter_5147-dec-12-21-27.gif

graph source

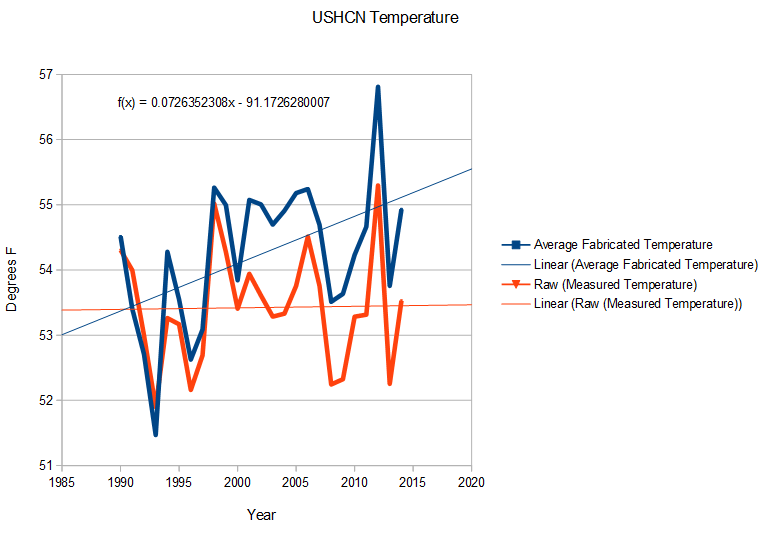
Above is the disconnect between reality and the new method of fabrication by the people at NASA and NOAA.

gissustampering.gif

graph source

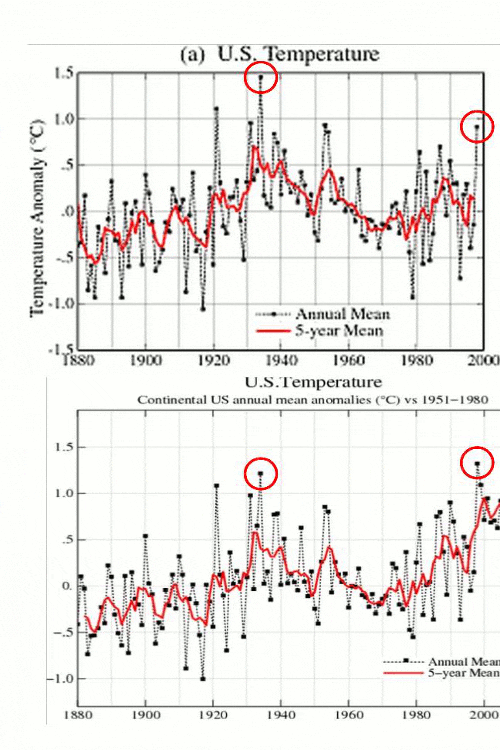
This is what data homogenization does to the temperature record.

Now lets look at the most pristine earth climate data collection system in the world. The USCRN.

uscrn_average_conus_jan2004-april20141.png


This is the US Unadjusted Data average temp using the 114 USCRN stations. You will note that the decline in temp is equal to the decline in the UNADJUSTED USHCN with minor exceptions of the urbanized city settings. (Urban Heat Islands).
U.S. Climate Reference Network (USCRN)
Data from NOAA's premiere surface reference network. The contiguous U.S. network of 114 stations was completed in 2008. There are two USCRN stations in Hawaii and deployment of a network of 29 stations in Alaska continues. The vision of the USCRN program is to maintain a sustainable high-quality climate observation network that 50 years from now can with the highest degree of confidence answer the question: How has the climate of the Nation changed over the past 50 years?

These stations were designed with climate science in mind. Three independent measurements of temperature and precipitation are made at each station, insuring continuity of record and maintenance of well-calibrated and highly accurate observations. The stations are placed in pristine environments expected to be free of development for many decades. Stations are monitored and maintained to high standards and are calibrated on an annual basis. In addition to temperature and precipitation, these stations also measure solar radiation, surface skin temperature, and surface winds. They also include triplicate measurements of soil moisture and soil temperature at five depths, as well as atmospheric relative humidity for most of the 114 contiguous U.S. stations. Stations in Alaska and Hawaii provide network experience and observations in polar and tropical regions. Deployment of a complete 29-station USCRN network in Alaska began in 2009. This project is managed by NOAA's National Climatic Data Center and operated in partnership with NOAA's Atmospheric Turbulence and Diffusion Division.
Source

So what is their JUSTIFICATION for adjusting up the temperature record by 1.6 deg C in total when their near perfect system for no needed adjustments tells them their tinkering is not only wrong but unwarranted?
 
I need to add that homogenizations' only legitimate purpose in science is to remove out specific trends in the data so as to more clearly see other signals within the data set. Unless you know what your looking at it is a deceptive way of changing the data for and agenda.
 
Billy Boob, go ahead and quote stupid asses that use names not their own in order to give some kind of veracity to their false claims.

Steven Goddard DeSmogBlog

Background
Steven Goddard is a global warming skeptic and guest author at the climate change skeptic blog WattsUpWithThat (WUWT). The name “Steven Goddard” is a pseudonym used by Tony Heller, according to the Heartland Institute. [2]

Goddard is known for a 2008 article in The Register where he posited that Arctic Sea ice is not receding and claimed that data from the National Snow and Ice Data Center (NSIDC) showing the opposite was incorrect. Goddard later issued a retraction on his statement. [3],[4]

Goddard operates a blog titled “Real Science” blog, originally Real-Science.com, and now as the Wordpress blog Real Science. Goddard has gone to some lengths to keep his identity hidden and his blog's web domain has been blocked from any identifying WhoIs information.
 
Alarmist Adjustments of GISS/NOAA Data are fraud on the US Citizens..


With all the crap being spewn about by the alarmist of the hottest this or that I believe it is time to expose their lies and fraud of adjustments. Not one of the alarmists here has justified their unfaltering cult like belief of everything government has told them to believe.

Data homogenization; there are two types. the first is the altering of station data by grouping five or more stations and averaging them. The problem lies in the poor quality of the stations surrounding a high quality station which has its data altered to match the poor stations. this results in short term increased temp numbers which in long term alter the whole climate record. The second is using roaming 3, 4, 5 ,6, 10, 12, 15 year averages eliminating the yearly rises resulting in past temp record drops in temp and raising the near term temps. This creates huge errors of 3-5 degree C swings in the temperature records. Neither of these methods is scientific and both are agenda driven to "appear" like science.

screenhunter_5147-dec-12-21-27.gif

graph source

Above is the disconnect between reality and the new method of fabrication by the people at NASA and NOAA.


gissustampering.gif

graph source

This is what data homogenization does to the temperature record.

Now lets look at the most pristine earth climate data collection system in the world. The USCRN.

uscrn_average_conus_jan2004-april20141.png


This is the US Unadjusted Data average temp using the 114 USCRN stations. You will note that the decline in temp is equal to the decline in the UNADJUSTED USHCN with minor exceptions of the urbanized city settings. (Urban Heat Islands).
U.S. Climate Reference Network (USCRN)
Data from NOAA's premiere surface reference network. The contiguous U.S. network of 114 stations was completed in 2008. There are two USCRN stations in Hawaii and deployment of a network of 29 stations in Alaska continues. The vision of the USCRN program is to maintain a sustainable high-quality climate observation network that 50 years from now can with the highest degree of confidence answer the question: How has the climate of the Nation changed over the past 50 years?

These stations were designed with climate science in mind. Three independent measurements of temperature and precipitation are made at each station, insuring continuity of record and maintenance of well-calibrated and highly accurate observations. The stations are placed in pristine environments expected to be free of development for many decades. Stations are monitored and maintained to high standards and are calibrated on an annual basis. In addition to temperature and precipitation, these stations also measure solar radiation, surface skin temperature, and surface winds. They also include triplicate measurements of soil moisture and soil temperature at five depths, as well as atmospheric relative humidity for most of the 114 contiguous U.S. stations. Stations in Alaska and Hawaii provide network experience and observations in polar and tropical regions. Deployment of a complete 29-station USCRN network in Alaska began in 2009. This project is managed by NOAA's National Climatic Data Center and operated in partnership with NOAA's Atmospheric Turbulence and Diffusion Division.
Source

So what is their JUSTIFICATION for adjusting up the temperature record by 1.6 deg C in total when their near perfect system for no needed adjustments tells them their tinkering is not only wrong but unwarranted?


dont forget the 'kridging' method whereby the computer algorithm picks out 'break points' by expecting certain outcomes (warming usually) , and then aligns the break points together. this could be reasonable if there was physical evidence that a legitimate reason had caused the break but most of the time the kridging is done automatically without checking for causes. and some of the time even seemingly real causes dont make sense. last summer Luling Texas was investigated. BEST declared a break point, and said it was because of a station move. in fact, it was only a more exact GPS measurement with no station move, and certainly no elevation change. yet they modified it a whole degree if I remember correctly.
 
how is Goddard any different than Tamino or Sou?

besides him actually mixing in information with his ad homs?
 
Because unlike Tamino or Sou, Goddard has a long history of fudging and twisting data to fit his agenda.

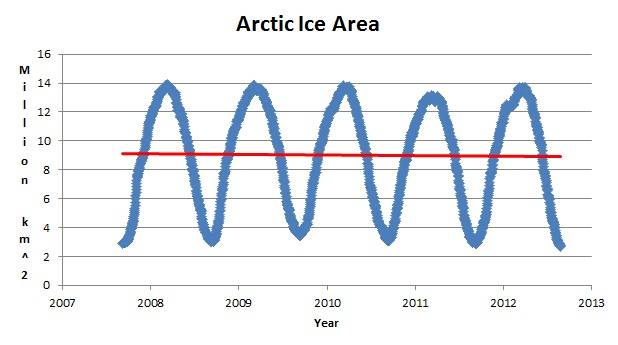
For example, this is the Arctic sea ice extent data that Goddard links to and says he used for a graph, and the graph you get if you plot it all without selecting a small subset, shifting the baseline and using a blue crayon line.

http://arctic.atmos.uiuc.edu/cryosphere/timeseries.anom.1979-2008

seaice-anomaly-arctic.png


This is what Goddard turned the graph into. Fudge alert! Fudge alert! Fudge alert! All hands to battle stations!

Visualizing Arctic Neurosis Real Science

screenhunter_191-aug-25-06-55.jpg


If necessary, I can keep going with additional examples of goddard-fudging for quite a long time. For now, I'll just add this last tidbit. Goddard is a birfer.

June 27 2004 Leading Kenyan Newspaper Said Obama was Born In Kenya Real Science
 
Last edited:
Because unlike Tamino or Sou, Goddard has a long history of fudging and twisting data to fit his agenda.

For example, this is the Arctic sea ice extent data that Goddard links to and says he used for a graph, and the graph you get if you plot it all without selecting a small subset, shifting the baseline and using a blue crayon line.

http://arctic.atmos.uiuc.edu/cryosphere/timeseries.anom.1979-2008

seaice-anomaly-arctic.png


This is what Goddard turned the graph into. Fudge alert! Fudge alert! Fudge alert! All hands to battle stations!

Visualizing Arctic Neurosis Real Science

screenhunter_191-aug-25-06-55.jpg


If necessary, I can keep going with additional examples of goddard-fudging for quite a long time. For now, I'll just add this last tidbit. Goddard is a birfer.

June 27 2004 Leading Kenyan Newspaper Said Obama was Born In Kenya Real Science

Stop your graphing in 2008 just as the ice was beginning to return... Too funny.. Cant even be truthful about the state of the current global ice sheets. Here hairball, let me help you out of your fantasy..

iphone.anomaly.global.png


We wouldn't want you mislead people and create fear...
 
Because unlike Tamino or Sou, Goddard has a long history of fudging and twisting data to fit his agenda.

For example, this is the Arctic sea ice extent data that Goddard links to and says he used for a graph, and the graph you get if you plot it all without selecting a small subset, shifting the baseline and using a blue crayon line.

http://arctic.atmos.uiuc.edu/cryosphere/timeseries.anom.1979-2008

seaice-anomaly-arctic.png


This is what Goddard turned the graph into. Fudge alert! Fudge alert! Fudge alert! All hands to battle stations!

Visualizing Arctic Neurosis Real Science

screenhunter_191-aug-25-06-55.jpg


If necessary, I can keep going with additional examples of goddard-fudging for quite a long time. For now, I'll just add this last tidbit. Goddard is a birfer.

June 27 2004 Leading Kenyan Newspaper Said Obama was Born In Kenya Real Science

Tamino (aka: Greg Foster) and Sou have been faking data for a long time. Hell try to show evidence that they are wrong on their blog and see how fast they delete it..
 
You're defending "Goddard". He's the indefensible thing here.

When you can find a number of actual climate scientists who believe these adjustments are the fraud and deceit you deniers believe them to be, drop us a line.

And not one piece of scientific evidence to show any credibility to the adjustments.. Interesting..
 
Billy Boob, go ahead and quote stupid asses that use names not their own in order to give some kind of veracity to their false claims.

Steven Goddard DeSmogBlog

Background
Steven Goddard is a global warming skeptic and guest author at the climate change skeptic blog WattsUpWithThat (WUWT). The name “Steven Goddard” is a pseudonym used by Tony Heller, according to the Heartland Institute. [2]

Goddard is known for a 2008 article in The Register where he posited that Arctic Sea ice is not receding and claimed that data from the National Snow and Ice Data Center (NSIDC) showing the opposite was incorrect. Goddard later issued a retraction on his statement. [3],[4]

Goddard operates a blog titled “Real Science” blog, originally Real-Science.com, and now as the Wordpress blog Real Science. Goddard has gone to some lengths to keep his identity hidden and his blog's web domain has been blocked from any identifying WhoIs information.
He has made mistakes like any scientist, but my use of his data has been checked and rechecked to ensure that the findings are correct. You see science is supposed to be open and accountable. We see none of this from the alarmist side of the camp. With Goddard he is willing and does give up his data, methods and programs with which he does his work. The likes of Mann, Foster, Hansen, and the EAU crowd simply wont do this.. My question is why? What they are doing is anti-science and gives the perception of lies and deceit while they try and hide their lies from view.. Now that the truth is coming out by the earth itself and their work has been shown fraud there really isn't anywhere they can hide any more.
 
climate-past.png


University of Utah Paleo study shows that our current warming period and the coming cooling period are not uncommon or man made...

SALT LAKE CITY, Dec. 15, 2014 – The rate at which carbon emissions warmed Earth’s climate almost 56 million years ago resembles modern, human-caused global warming much more than previously believed, but involved two pulses of carbon to the atmosphere, University of Utah researchers and their colleagues found.

The findings mean the so-called Paleocene-Eocene thermal maximum, or PETM, can provide clues to the future of modern climate change. The good news: Earth and most species survived. The bad news: It took millennia to recover from the episode, when temperatures rose by 5 to 8 degrees Celsius (9 to 15 degrees Fahrenheit).

"Bowen cautioned, however, that global climate already was much warmer than today’s when the Paleocene-Eocene warming began, and there were no icecaps, “so this played out on a different playing field than what we have today.”

Ouch! this one is gonna hurt the alarmist camp and their BS AGW lie..

Source

The study shows that there have been many warm ups and many high level CO2 build ups without man and at faster rates than we have seen today. Going to be one big ouch for the Alarmist camp..
 
Last edited:
Anthony Watts has about as much credibility as the obese junkie on the AM radio.

If you truly want to compare the geological history of GHG events, then you might want to look at the PT Extinction event, or the Triassic-Jurassic Extinction event.

What you seem to be saying is that because warmings have occurred without humans that were caused by sudden increases in GHGs, that humans cannot create warming by suddenly increasing the GHGs. The physics is the same for sudden increases in GHGs, no matter what the cause.

Your adhom attacks are unwarranted and quite frankly show your second grade mentality. Grow up.

Sudden increases in CO2 happen and as the study shows they can happen and have happened without man. It also shows how the earth responded and didn't warm up. A contrary position to your GHG gospel.

SO tell me why the adjustments are necessary when a system requiring no adjustments shows that they are not warranted.
 
Climate Extremes Observations Modeling and Impacts


Climate Extremes: Observations, Modeling, and Impacts
  1. David R. Easterling1,*,
  2. Gerald A. Meehl2,
  3. Camille Parmesan3,
  4. Stanley A. Changnon4,
  5. Thomas R. Karl1,
  6. Linda O. Mearns2
+Author Affiliations

  1. ABSTRACT
    One of the major concerns with a potential change in climate is that an increase in extreme events will occur. Results of observational studies suggest that in many areas that have been analyzed, changes in total precipitation are amplified at the tails, and changes in some temperature extremes have been observed. Model output has been analyzed that shows changes in extreme events for future climates, such as increases in extreme high temperatures, decreases in extreme low temperatures, and increases in intense precipitation events. In addition, the societal infrastructure is becoming more sensitive to weather and climate extremes, which would be exacerbated by climate change. In wild plants and animals, climate-induced extinctions, distributional and phenological changes, and species' range shifts are being documented at an increasing rate. Several apparently gradual biological changes are linked to responses to extreme weather and climate events.
Real scientists addressing the issue.
 
Hydrothermal venting of greenhouse gases triggering Early Jurassic global warming

The climate change in the Toarcian (Early Jurassic) was characterized by a major perturbation of the global carbon cycle. The event lasted for approximately 200,000 years and was manifested by a global warming of ∼ 6 °C, anoxic conditions in the oceans, and extinction of marine species. The triggering mechanisms for the perturbation and environmental change are however strongly debated. Here, we present evidence for a rapid formation and transport of greenhouse gases from the deep sedimentary reservoirs in the Karoo Basin, South Africa. Magmatic sills were emplaced during the initial stages of formation of the Early Jurassic Karoo Large Igneous Province, and had a profound influence on the fate of light elements in the organic-rich sedimentary host rocks. Total organic carbon contents and vitrinite reflectivity data from contact aureoles around the sills show that organic carbon was lost from the country rocks during heating. We present data from a new type of geological structures, termed breccia pipes, rooted in the aureoles within the shale of the Western Karoo Basin. The breccia pipes are cylindrical structures up to 150 meters in diameter and are mainly comprised of brecciated and baked black shale. Thousands of breccia pipes were formed due to gas pressure build-up during metamorphism of the shales, resulting in venting of greenhouse gases to the Toarcian atmosphere. Mass balance calculations constrained by new aureole data show that up to 1800 Gt of CO2 was formed from organic material in the western Karoo Basin. About 15 times this amount of CO2 (27,400 Gt) may have formed in the entire basin during the intrusive event. U–Pb dating of zircons from a sill related to many of the pipes demonstrates that the magma was emplaced 182.5 ± 0.4 million years ago. This supports a causal relationship between the intrusive volcanism, the gas venting, and the Toarcian global warming.

More scientists.
 
Mass extinctions of life and catastrophic flood basalt volcanism


Performing your original search "GHGs and extinction events" in PNAS retrieves 3 additional results.
Mass extinctions of life and catastrophic flood basalt volcanism
  1. Michael R. Rampino1
Author Affiliations

  1. Extract
  2. Full Text
  3. Authors & Info
  4. Metrics
  5. Related Content
  6. PDF

Extinctions have played an important role in the history of life by clearing out niches and fostering adaptive radiations. Major mass extinctions involving 70% to more than 90% of extant species occurred at least five times during the last 540 million years. The discovery by Alvarez et al. (1) that the end-Cretaceous (65 Mya) mass extinction coincided with evidence for the impact of an asteroid or comet ∼10 km in diameter focused interest in the causes of the other mass extinctions. It was expected that evidence of a similar impact might be found at other mass extinction events. Such evidence, however, has been slow in coming (2). At the same time, episodic massive continental flood basalt eruptions were suggested as another possible cause of mass extinctions (3, 4). This connection is illustrated by a study by Whiteside et al. (5) that provides evidence that the eruption of the Central Atlantic magmatic province (CAMP) basalts, with a preserved volume greater than 1 × 10⁶ km3 and covering more than 7 × 10⁶ km2, coincided with the end-Triassic extinction event (ETE) (201.4 Mya) on land and in the oceans.

The report by Whiteside et al. (5) presents carbon-isotope results obtained from leaf wax n-alkanes, wood, and total organic carbon from two nonmarine sections from the Newark and Hartford Basins in …

Now there are many, many more articles concerning the link between rapid changes in GHGs and extinction events.
 
Climate Extremes Observations Modeling and Impacts


Climate Extremes: Observations, Modeling, and Impacts
  1. David R. Easterling1,*,
  2. Gerald A. Meehl2,
  3. Camille Parmesan3,
  4. Stanley A. Changnon4,
  5. Thomas R. Karl1,
  6. Linda O. Mearns2
+Author Affiliations

  1. ABSTRACT
    One of the major concerns with a potential change in climate is that an increase in extreme events will occur. Results of observational studies suggest that in many areas that have been analyzed, changes in total precipitation are amplified at the tails, and changes in some temperature extremes have been observed. Model output has been analyzed that shows changes in extreme events for future climates, such as increases in extreme high temperatures, decreases in extreme low temperatures, and increases in intense precipitation events. In addition, the societal infrastructure is becoming more sensitive to weather and climate extremes, which would be exacerbated by climate change. In wild plants and animals, climate-induced extinctions, distributional and phenological changes, and species' range shifts are being documented at an increasing rate. Several apparently gradual biological changes are linked to responses to extreme weather and climate events.
Real scientists addressing the issue.

Nope... NOT real because they start with a premise that has been falsified already..
 
Mass extinctions of life and catastrophic flood basalt volcanism


Performing your original search "GHGs and extinction events" in PNAS retrieves 3 additional results.
Mass extinctions of life and catastrophic flood basalt volcanism
  1. Michael R. Rampino1
Author Affiliations

  1. Extract
  2. Full Text
  3. Authors & Info
  4. Metrics
  5. Related Content
  6. PDF

Extinctions have played an important role in the history of life by clearing out niches and fostering adaptive radiations. Major mass extinctions involving 70% to more than 90% of extant species occurred at least five times during the last 540 million years. The discovery by Alvarez et al. (1) that the end-Cretaceous (65 Mya) mass extinction coincided with evidence for the impact of an asteroid or comet ∼10 km in diameter focused interest in the causes of the other mass extinctions. It was expected that evidence of a similar impact might be found at other mass extinction events. Such evidence, however, has been slow in coming (2). At the same time, episodic massive continental flood basalt eruptions were suggested as another possible cause of mass extinctions (3, 4). This connection is illustrated by a study by Whiteside et al. (5) that provides evidence that the eruption of the Central Atlantic magmatic province (CAMP) basalts, with a preserved volume greater than 1 × 10⁶ km3 and covering more than 7 × 10⁶ km2, coincided with the end-Triassic extinction event (ETE) (201.4 Mya) on land and in the oceans.

The report by Whiteside et al. (5) presents carbon-isotope results obtained from leaf wax n-alkanes, wood, and total organic carbon from two nonmarine sections from the Newark and Hartford Basins in …

Now there are many, many more articles concerning the link between rapid changes in GHGs and extinction events.


What a bunch of crap.. You didn't even read this link did you..? Now you can tell us when volcanoes are gonna erupt.... Now your being down right silly and making shit up as you go.. AGW is all knowing now and can make volcanoes..
 

Forum List

Back
Top