How Accurate are Global Temperatures?

The cause of the error, they say, was a switch to a new data-collection system in 2000 and a faulty assumption that the old and new methods matched, which last week led to a recalculation of the figures.

Now 1934 is the hottest year on record in the US at an average of 1.25C higher than normal; 1998 is second at 1.23C, and 1921 in third place at 1.15C. Under the old system, 1998 was the hottest at 1.24C above normal, with 1934 at 1.23C. 2006, newly relegated to fourth place, was also at 1.23C.
Blogger gets hot and bothered over Nasa's climate data error | Environment | The Guardian

I hate to seem obstinant over this point edthecynic, but how did 1934 and 1998 change places as the hottest year in the US if there were no adjustments in pre-1999 data?

And for Schmidt, he said it right in your post.
This is the third time I've posted this link regarding the error corrected in 2007. The correction you say was made in 2007 was made in 2001. Please read it this time.

Data.GISS: Surface Temperature Analysis: August 2007 Update and Effects

Contrary to some statements flying around the internet, there is no effect on the rankings of global temperature. Also our prior analysis had 1934 as the warmest year in the U.S. (see the 2001 paper above), and it continues to be the warmest year, both before and after the correction to post 2000 temperatures. However, as we note in that paper, the 1934 and 1998 temperature are practically the same, the difference being much smaller than the uncertainty.

Just so I have this straight. The main correction was in 2000-2001 when the pre-1999 data was massively changed and the trend lines twisted upwards. You are OK with that. The second correction was in 2007 after an outsider found the Y2K bug and the 2000's data was dropped .15 degrees and pre-1999 data was changed again. You are saying that I can't bring up pre-1999 changes in data because they were all supposed to be made the first time. Hmmm. Seems like you and NASA are playing a game of 'heads we win, tails you lose'. Perhaps if reasons and methodologies for all of these corrections were out in the open there wouldn't be so much suspicion.

Anyways, pre-1999 data was changed when the Y2K correction was made and until it can be established that the temperature series couldn't be fixed by better manipulation of the 2000's series, I am sticking with my contention that NASA is playing a shell game by reconstructing historic data to get the resulting temperature trends and reconciliation with other temperature data sets that it wants.
Damn you are pigheaded!!!!!

How many times do you have to be shown that the pre 1999 data was NOT changed in 2007?!!!!!!!!!!!!!!!!!!!!!!!!!!!!!!!!!

And the methodology for all the changes including the 2001 changes were made quite public and I have already linked to them and posted pull quotes that explain the improvements in the accuracy of the data, such as using satellite data to locate and adjust for urban heat islands, averaging urban heat islands with neighboring rural stations and dropping urban heat island stations that do not have rural stations nearby.

Just because you can't face the truth does not make it any less truthful, just as repeating the lie that data before 1999 was changed in 2007 does not make it any less of a lie.

I really like it when you put your thoughts down in your own words rather than C&P. It helps me figure out where you are coming from.

You seem to think your guys are forthright and next to infallible. I just looked at the temp numbers for GISS US, unfortunately I haven't found a pre-1999 set that I trust, but the 2006(pre fix), 2007(post fix), 2007(post post fix) paint an odd story. Pre-1999 figures started low, corrected higher, then decreased again. Post-2000 figures started high, corrected lower, then increased again. Pretty much back to where they started from. I'll give actual figures when I can find a pre-1999 data set, unfortunately the Way Back machine only goes back to 2006 (or the name has been changed).


e said
explain the improvements in the accuracy of the data, such as using satellite data to locate and adjust for urban heat islands, averaging urban heat islands with neighboring rural stations and dropping urban heat island stations that do not have rural stations nearby.

you really haven't looked into those improvements much, have you? hahaha. It is hard to even know where to start on that subject. its another case of ineptitude being pointed out by outsiders and then climate science saying they found it and corrected the problem when it hasn't been fixed at all.
If only you had a thought of your own instead of parroting the crap from CON$ervative pundits.

A perfect example is your claim that "pre 1999 figures started low, corrected higher" and then you admitted you could find no pre 1999 figures so how could you possibly know where they started from or what direction they corrected to except by parroting what others fed you and you swallowed whole.
Thank you.
 
Last edited:
Damn you are pigheaded!!!!!

How many times do you have to be shown that the pre 1999 data was NOT changed in 2007?!!!!!!!!!!!!!!!!!!!!!!!!!!!!!!!!!

And the methodology for all the changes including the 2001 changes were made quite public and I have already linked to them and posted pull quotes that explain the improvements in the accuracy of the data, such as using satellite data to locate and adjust for urban heat islands, averaging urban heat islands with neighboring rural stations and dropping urban heat island stations that do not have rural stations nearby.

Just because you can't face the truth does not make it any less truthful, just as repeating the lie that data before 1999 was changed in 2007 does not make it any less of a lie.

I really like it when you put your thoughts down in your own words rather than C&P. It helps me figure out where you are coming from.

You seem to think your guys are forthright and next to infallible. I just looked at the temp numbers for GISS US, unfortunately I haven't found a pre-1999 set that I trust, but the 2006(pre fix), 2007(post fix), 2007(post post fix) paint an odd story. Pre-1999 figures started low, corrected higher, then decreased again. Post-2000 figures started high, corrected lower, then increased again. Pretty much back to where they started from. I'll give actual figures when I can find a pre-1999 data set, unfortunately the Way Back machine only goes back to 2006 (or the name has been changed).


e said
explain the improvements in the accuracy of the data, such as using satellite data to locate and adjust for urban heat islands, averaging urban heat islands with neighboring rural stations and dropping urban heat island stations that do not have rural stations nearby.

you really haven't looked into those improvements much, have you? hahaha. It is hard to even know where to start on that subject. its another case of ineptitude being pointed out by outsiders and then climate science saying they found it and corrected the problem when it hasn't been fixed at all.
If only you had a thought of your own instead of parroting the crap from CON$ervative pundits.

A perfect example is your claim that "pre 1999 figures started low, corrected higher" and then you admitted you could find no pre 1999 figures so how could you possibly know where they started from or what direction they corrected to except by parroting what others fed you and you swallowed whole.
Thank you.

Actually, I said 'a pre-1999 data set that I trust'. I have found several graphs that show visual rather than numerical figures.

The story of the Y2K bug and subsequent fixes is much more complex and interesting than I thought. It certainly is not the story of NASA making a simple fix after being informed of the error. And it involves NASA going back and recalculating (pre-1999)data at least twice during 2007.

And the really strange part is that this year's GISS figures seem to have erased most of the post-2000 decreases and dropped early 1900's as well.

More later
 
Last edited:
I really like it when you put your thoughts down in your own words rather than C&P. It helps me figure out where you are coming from.

You seem to think your guys are forthright and next to infallible. I just looked at the temp numbers for GISS US, unfortunately I haven't found a pre-1999 set that I trust, but the 2006(pre fix), 2007(post fix), 2007(post post fix) paint an odd story. Pre-1999 figures started low, corrected higher, then decreased again. Post-2000 figures started high, corrected lower, then increased again. Pretty much back to where they started from. I'll give actual figures when I can find a pre-1999 data set, unfortunately the Way Back machine only goes back to 2006 (or the name has been changed).


e said

you really haven't looked into those improvements much, have you? hahaha. It is hard to even know where to start on that subject. its another case of ineptitude being pointed out by outsiders and then climate science saying they found it and corrected the problem when it hasn't been fixed at all.
If only you had a thought of your own instead of parroting the crap from CON$ervative pundits.

A perfect example is your claim that "pre 1999 figures started low, corrected higher" and then you admitted you could find no pre 1999 figures so how could you possibly know where they started from or what direction they corrected to except by parroting what others fed you and you swallowed whole.
Thank you.

Actually, I said 'a pre-1999 data set that I trust'. I have found several graphs that show visual rather than numerical figures.

The story of the Y2K bug and subsequent fixes is much more complex and interesting than I thought. It certainly is not the story of NASA making a simple fix after being informed of the error. And it involves NASA going back and recalculating (pre-1999)data at least twice during 2007.

And the really strange part is that this year's GISS figures seem to have erased most of the post-2000 decreases and dropped early 1900's as well.

More later
Don't you deniers ever get tired of repeating the same lies over and over?????

There was only one change in August 2007 due to the error McIntyre found. A later update had nothing to do with McIntyre, and YOU know it!!!!!

Here again is the correction made for the error McIntyre found and the BS you deniers fabricated.

http://www.columbia.edu/~jeh1/mailings/2007/20070816_realdeal.pdf

This discontinuity can be removed by comparing USHCN and GHCN records just before 2000, and this correction was made to the GISS computer program on 7 August 2007 with a note to that effect made on the GISTEMP web page.]

How big an error did this flaw cause? That is shown by the before and after results in Figure 1. The effect on the global temperature record is invisible. The effect on U.S. average temperature is about 0.15°C beginning in 2000. Does this change have any affect whatsoever on the global warming issue? Certainly not, as discussed below.

What we have here is a case of dogged contrarians who present results in ways intended to deceive the public into believing that the changes have greater significance than reality. They aim to make a mountain out of a mole hill. I believe that these people are not stupid, instead they seek to create a brouhaha and muddy the waters in the climate change story. They seem to know exactly what they are doing and believe they can get away with it, because the public does not have the time, inclination, and training to discern what is a significant change with regard to the global warming issue.

The proclamations of the contrarians are a deceit, but their story raises a more important matter, usufruct. It is the most important issue in the entire global warming story, in my opinion. The players in the present U.S. temperature story, we scientists included, are just bit players. The characters in the main drama are big fish, really big fish. But before we get to that matter, I need to expose how the deceit works.

Instead of showing the impact of the flaw in our analysis program via a graph such as Figure 1, as a scientist would do (and as would immediately reveal how significant the flaw was), they instead discuss ranking of temperature in different years, including many false statements. We have thus been besieged by journalists saying “they say that correcting your error caused the warmest year to become 1934 rather than a recent year, is that right!?”

Hardly. First of all, many journalists had the impression that they were talking about global temperature. As you can see from Figure 1a, global warming is unaffected by the flaw. This realization should be enough to make most journalists lose interest, as global warming refers to global temperature.

But what if you are a chauvinist and only care about temperature in the United States? Did correcting the flaw in the program change the time of calculated maximum temperature to 1934? No. If you look at our 2001 paper, and get out your micrometer, you will see that we found 1934 to be the warmest year in the United States, by a hair, of the order of 0.01°C warmer than 1998, the same as the result that we find now. Of course the difference in the 1934 and 1998 temperatures is not significant, and we made clear in our paper that such years have to be declared as being practically a dead-heat.
 
Google cached a version on Jul 23, 2007 15:04:08 GMT. Here it is: (PRE Y2K FIX)
Contiguous 48 U.S. Surface Air Temperature Anomaly (C)
——————————————————
year Annual_Mean 5-year_Mean
———————————

1921 1.12 .14


1990 .88 .41
1991 .70 .26
1992 .31 .39
1993 -.43 .28
1994 .47 .11
1995 .35 .06
1996 -.17 .39
1997 .05 .48
1998 1.24 .54
1999 .94 .76
2000 .65 .88
2001 .90 .76
2002 .68 .69
2003 .65 .73
2004 .60 .80
2005 .85 *
2006 1.23 *


Sept 14 2007
Contiguous 48 U.S. Surface Air Temperature Anomaly (C) (AFTER FIX)
------------------------------------------------------
year Annual_Mean 5-year_Mean
---------------------------------

1921 1.15 .1


1990 .87 .40
1991 .69 .25
1992 .30 .38
1993 -.44 .27
1994 .46 .10
1995 .34 .05
1996 -.17 .38
1997 .03 .47
1998 1.23 .51
1999 .93 .69
2000 .52 .79
2001 .76 .65
2002 .53 .55
2003 .50 .58
2004 .44 .66
2005 .69 *
2006 1.13 *
---------------------------------

Oct 11 2007
Contiguous 48 U.S. Surface Air Temperature Anomaly (C)
------------------------------------------------------
year Annual_Mean 5-year_Mean
---------------------------------

1921 1.13 .13


1990 .88 .41
1991 .70 .26
1992 .31 .39
1993 -.43 .28
1994 .47 .11
1995 .36 .06
1996 -.16 .39
1997 .04 .48
1998 1.24 .52
1999 .94 .71
2000 .54 .81
2001 .78 .67
2002 .55 .57
2003 .53 .61
2004 .46 .68
2005 .71 *
2006 1.15 *


(from today)
Contiguous 48 U.S. Surface Air Temperature Anomaly (C)
------------------------------------------------------
year Annual_Mean 5-year_Mean
---------------------------------

1921 1.08 0.09


1990 0.92 0.46
1991 0.71 0.31
1992 0.37 0.44
1993 -0.35 0.34
1994 0.55 0.19
1995 0.43 0.14
1996 -0.06 0.48
1997 0.15 0.58
1998 1.32 0.63
1999 1.07 0.83
2000 0.69 0.94
2001 0.92 0.81
2002 0.68 0.72
2003 0.69 0.76
2004 0.61 0.84
2005 0.92 0.88
2006 1.30 0.76
2007 0.87 0.69
2008 0.11 *
2009 0.24 *


I left 1921 in because it was considered a top ten warmest year after the initial fix. These tables pretty much prove that NASA did change, and continue to change pre-1999 data. It would be very interesting to see the actual raw data but that is pretty much a state secret. But I do wonder how much of the warming trend is solely due to their 'adjustments'.
 
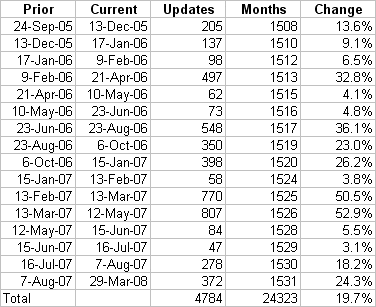
On March 29 I downloaded the GLB.Ts.txt file from GISS and compared it to a copy I had from late August 2007. I was surprised to find several hundred differences in monthly temperature. Intrigued, I decided to take a trip back in time via the “Way Back Machine”.

Here I found 32 versions of GLB.Ts.txt going back to September 24, 2005. I was a bit disappointed the record did not go back further, but was later surprised at how many historical changes can occur in a brief 2 1/2 years.The first thing I did was eliminate versions where no changes to the data were made. I then compared the number of monthly differences between the remaining sequential records and built the following table. Here I show the “Prior” record compared to the next sequential record (referred to as “Current”). The number of changes made to the monthly record between Prior and Current is shown in the “Updates” column (this column does not count additions to the record – only changes to existing data are counted). The number of valid months contained in the Prior record is in the “Months” column. “Change” is simply the percent Updates made to Months.

gbl_table.gif


On average 20% of the historical record was modified 16 times in the last 2 1/2 years. The largest single jump was 0.27 C. This occurred between the Oct 13, 2006 and Jan 15, 2007 records when Aug 2006 changed from an anomoly of +0.43C to +0.70C, a change of nearly 68%.

Wow.

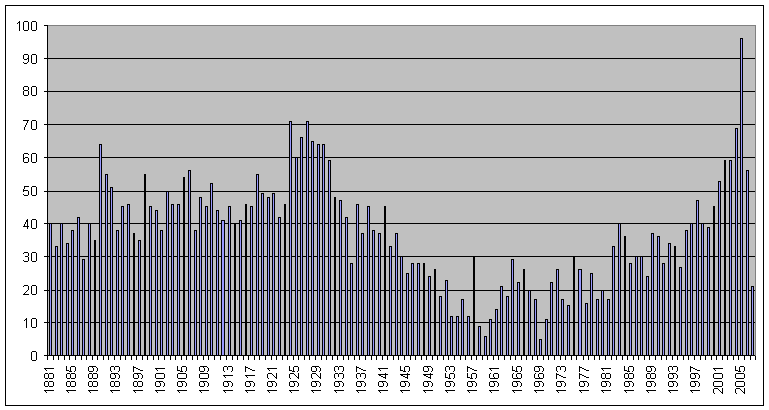
The next question I had was “how often are the months within specific years modified?” As can be seen in the next chart, a surprising number of the earliest monthly averages are modified time and again.

gbl_yearly_changes.gif


I was surprised at how much of the pre-Y2K temperature record changed! My personal favorite change was between the August 16, 2007 file and the March 29, 2008 file. Suddenly, in the later file, the J-D annual temperature for 1880 could now be calculated. In all previous versions the temperature could not be determined.

from Climate Audit, the guys that found the Y2K bug Rewriting History, Time and Time Again Climate Audit

Edit- sorry, I did not realize that I left out the quote box
 
Last edited:
Google cached a version on Jul 23, 2007 15:04:08 GMT. Here it is: (PRE Y2K FIX)
Contiguous 48 U.S. Surface Air Temperature Anomaly (C)
——————————————————
year Annual_Mean 5-year_Mean
———————————

1921 1.12 .14


1990 .88 .41
1991 .70 .26
1992 .31 .39
1993 -.43 .28
1994 .47 .11
1995 .35 .06
1996 -.17 .39
1997 .05 .48
1998 1.24 .54
1999 .94 .76
2000 .65 .88
2001 .90 .76
2002 .68 .69
2003 .65 .73
2004 .60 .80
2005 .85 *
2006 1.23 *


Sept 14 2007
Contiguous 48 U.S. Surface Air Temperature Anomaly (C) (AFTER FIX)
------------------------------------------------------
year Annual_Mean 5-year_Mean
---------------------------------

1921 1.15 .1


1990 .87 .40
1991 .69 .25
1992 .30 .38
1993 -.44 .27
1994 .46 .10
1995 .34 .05
1996 -.17 .38
1997 .03 .47
1998 1.23 .51
1999 .93 .69
2000 .52 .79
2001 .76 .65
2002 .53 .55
2003 .50 .58
2004 .44 .66
2005 .69 *
2006 1.13 *
---------------------------------
These tables pretty much prove that NASA did change, and continue to change pre-1999 data. It would be very interesting to see the actual raw data but that is pretty much a state secret. But I do wonder how much of the warming trend is solely due to their 'adjustments'.
Those tables prove that the lies are PREMEDITATED!

As I said, the correction for the error McIntyre found was made on August 7, 2007. Conspicuously absent from your tables is the August 7 update data!!!!

Another update was made on Sept 10, 2007, but it had nothing to do with the McIntyre error and low and behold the table you and your dishonest source use is from AFTER that update.

Like I said before, it takes a better liar than you and your programmer to deceive a Cynic.
But do try again.
 
from Aug 8 2007. I used the Sep graph because it was very similar and directly off the Way Back machine
http://data.giss.nasa.gov/gistemp/graphs/Fig.D.txt

Contiguous 48 U.S. Surface Air Temperature Anomaly (C)
------------------------------------------------------
year Annual_Mean 5-year_Mean
---------------------------------
1880 -.26 *
1881 .29 *
1882 .07 -.24
1883 -.68 -.30
1884 -.63 -.41
1885 -.54 -.46
1886 -.28 -.39
1887 -.17 -.21
1888 -.32 -.06
1889 .28 -.04
1890 .20 -.11
1891 -.20 -.19
1892 -.51 -.21
1893 -.72 -.38
1894 .17 -.30
1895 -.66 -.22
1896 .19 -.10
1897 -.08 -.22
1898 -.15 .03
1899 -.41 .00
1900 .57 -.01
1901 .05 -.11
1902 -.13 -.13
1903 -.65 -.34
1904 -.48 -.35
1905 -.47 -.37
1906 -.02 -.21
1907 -.24 -.17
1908 .14 -.02
1909 -.27 .02
1910 .28 -.11
1911 .17 -.15
1912 -.88 -.08
1913 -.03 -.16
1914 .09 -.29
1915 -.15 -.33
1916 -.50 -.31
1917 -1.06 -.35
1918 .06 -.40
1919 -.10 -.07
1920 -.41 .17
1921 1.15 .15
1922 .18 .02
1923 -.07 .17
1924 -.74 -.05
1925 .36 -.05
1926 .04 -.02
1927 .15 .01
1928 .07 -.03
1929 -.58 .18
1930 .16 .15
1931 1.08 .27
1932 .00 .63
1933 .68 .61
1934 1.25 .44
1935 .04 .41
1936 .21 .45
1937 -.13 .37
1938 .86 .36
1939 .85 .45
1940 .03 .49
1941 .61 .35
1942 .09 .21
1943 .17 .19
1944 .14 .22
1945 -.03 .22
1946 .72 .17
1947 .10 .18
1948 -.08 .13
1949 .20 -.10
1950 -.28 -.05
1951 -.42 .14
1952 .32 .27
1953 .90 .32
1954 .85 .47
1955 -.03 .43
1956 .29 .26
1957 .14 .13
1958 .06 .08
1959 .17 .02
1960 -.24 -.01
1961 -.02 .02
1962 -.02 -.03
1963 .19 -.01
1964 -.07 -.05
1965 -.11 -.07
1966 -.24 -.16
1967 -.10 -.19
1968 -.28 -.19
1969 -.23 -.16
1970 -.11 -.21
1971 -.10 -.11
1972 -.35 -.03
1973 .24 -.05
1974 .15 -.08
1975 -.20 .06
1976 -.25 -.09
1977 .37 -.24
1978 -.52 -.16
1979 -.60 .02
1980 .22 -.12
1981 .64 -.02
1982 -.36 .10
1983 -.01 -.03
1984 .00 -.01
1985 -.42 .22
1986 .73 .29
1987 .83 .25
1988 .32 .51
1989 -.19 .50
1990 .87 .40
1991 .69 .25
1992 .30 .38
1993 -.44 .27
1994 .46 .10
1995 .34 .05
1996 -.17 .38
1997 .03 .47
1998 1.23 .51
1999 .93 .69
2000 .52 .79
2001 .76 .65
2002 .53 .55
2003 .50 .58
2004 .44 .66
2005 .69 *
2006 1.13 *

anything else? when are you going to break down and admit that your heroes lied to you?

Record Events for Sun Sep 26, 2010 through Sat Oct 2, 2010
Total Records: 2671
Rainfall: 807
Snowfall: 6
High Temperatures: 1180
Low Temperatures: 46
Lowest Max Temperatures: 67
Highest Min Temperatures: 565

HAMweather Climate Center - Record High Temperatures for The Past Week - Continental US View
 
Chris- give it a rest. this sandbox is for me and edthecynic
 
Chris- give it a rest. this sandbox is for me and edthecynic

What will be the effect of adding 1,000 billion tons of CO2 to the atmosphere?

thats what, 31 times you have plunked that off topic comment into a thread discussing something else?

Sorry, Buckaroo, but this is the central question you are ignoring.

Now answer the question.

What will be the effect of adding 1,000 billion tons of CO2 to the atmosphere?
 
from Aug 8 2007. I used the Sep graph because it was very similar and directly off the Way Back machine
http://data.giss.nasa.gov/gistemp/graphs/Fig.D.txt

Contiguous 48 U.S. Surface Air Temperature Anomaly (C)
------------------------------------------------------
year Annual_Mean 5-year_Mean
---------------------------------
1880 -.26 *
1881 .29 *
1882 .07 -.24
1883 -.68 -.30
1884 -.63 -.41
1885 -.54 -.46
1886 -.28 -.39
1887 -.17 -.21
1888 -.32 -.06
1889 .28 -.04
1890 .20 -.11
1891 -.20 -.19
1892 -.51 -.21
1893 -.72 -.38
1894 .17 -.30
1895 -.66 -.22
1896 .19 -.10
1897 -.08 -.22
1898 -.15 .03
1899 -.41 .00
1900 .57 -.01
1901 .05 -.11
1902 -.13 -.13
1903 -.65 -.34
1904 -.48 -.35
1905 -.47 -.37
1906 -.02 -.21
1907 -.24 -.17
1908 .14 -.02
1909 -.27 .02
1910 .28 -.11
1911 .17 -.15
1912 -.88 -.08
1913 -.03 -.16
1914 .09 -.29
1915 -.15 -.33
1916 -.50 -.31
1917 -1.06 -.35
1918 .06 -.40
1919 -.10 -.07
1920 -.41 .17
1921 1.15 .15
1922 .18 .02
1923 -.07 .17
1924 -.74 -.05
1925 .36 -.05
1926 .04 -.02
1927 .15 .01
1928 .07 -.03
1929 -.58 .18
1930 .16 .15
1931 1.08 .27
1932 .00 .63
1933 .68 .61
1934 1.25 .44
1935 .04 .41
1936 .21 .45
1937 -.13 .37
1938 .86 .36
1939 .85 .45
1940 .03 .49
1941 .61 .35
1942 .09 .21
1943 .17 .19
1944 .14 .22
1945 -.03 .22
1946 .72 .17
1947 .10 .18
1948 -.08 .13
1949 .20 -.10
1950 -.28 -.05
1951 -.42 .14
1952 .32 .27
1953 .90 .32
1954 .85 .47
1955 -.03 .43
1956 .29 .26
1957 .14 .13
1958 .06 .08
1959 .17 .02
1960 -.24 -.01
1961 -.02 .02
1962 -.02 -.03
1963 .19 -.01
1964 -.07 -.05
1965 -.11 -.07
1966 -.24 -.16
1967 -.10 -.19
1968 -.28 -.19
1969 -.23 -.16
1970 -.11 -.21
1971 -.10 -.11
1972 -.35 -.03
1973 .24 -.05
1974 .15 -.08
1975 -.20 .06
1976 -.25 -.09
1977 .37 -.24
1978 -.52 -.16
1979 -.60 .02
1980 .22 -.12
1981 .64 -.02
1982 -.36 .10
1983 -.01 -.03
1984 .00 -.01
1985 -.42 .22
1986 .73 .29
1987 .83 .25
1988 .32 .51
1989 -.19 .50
1990 .87 .40
1991 .69 .25
1992 .30 .38
1993 -.44 .27
1994 .46 .10
1995 .34 .05
1996 -.17 .38
1997 .03 .47
1998 1.23 .51
1999 .93 .69
2000 .52 .79
2001 .76 .65
2002 .53 .55
2003 .50 .58
2004 .44 .66
2005 .69 *
2006 1.13 *

anything else? when are you going to break down and admit that your heroes lied to you?


Never. Ed is not a cynic. He's a delusional follower of a failed religion.
 

Forum List

Back
Top