Old Rocks
Diamond Member
- Thread starter
- #61
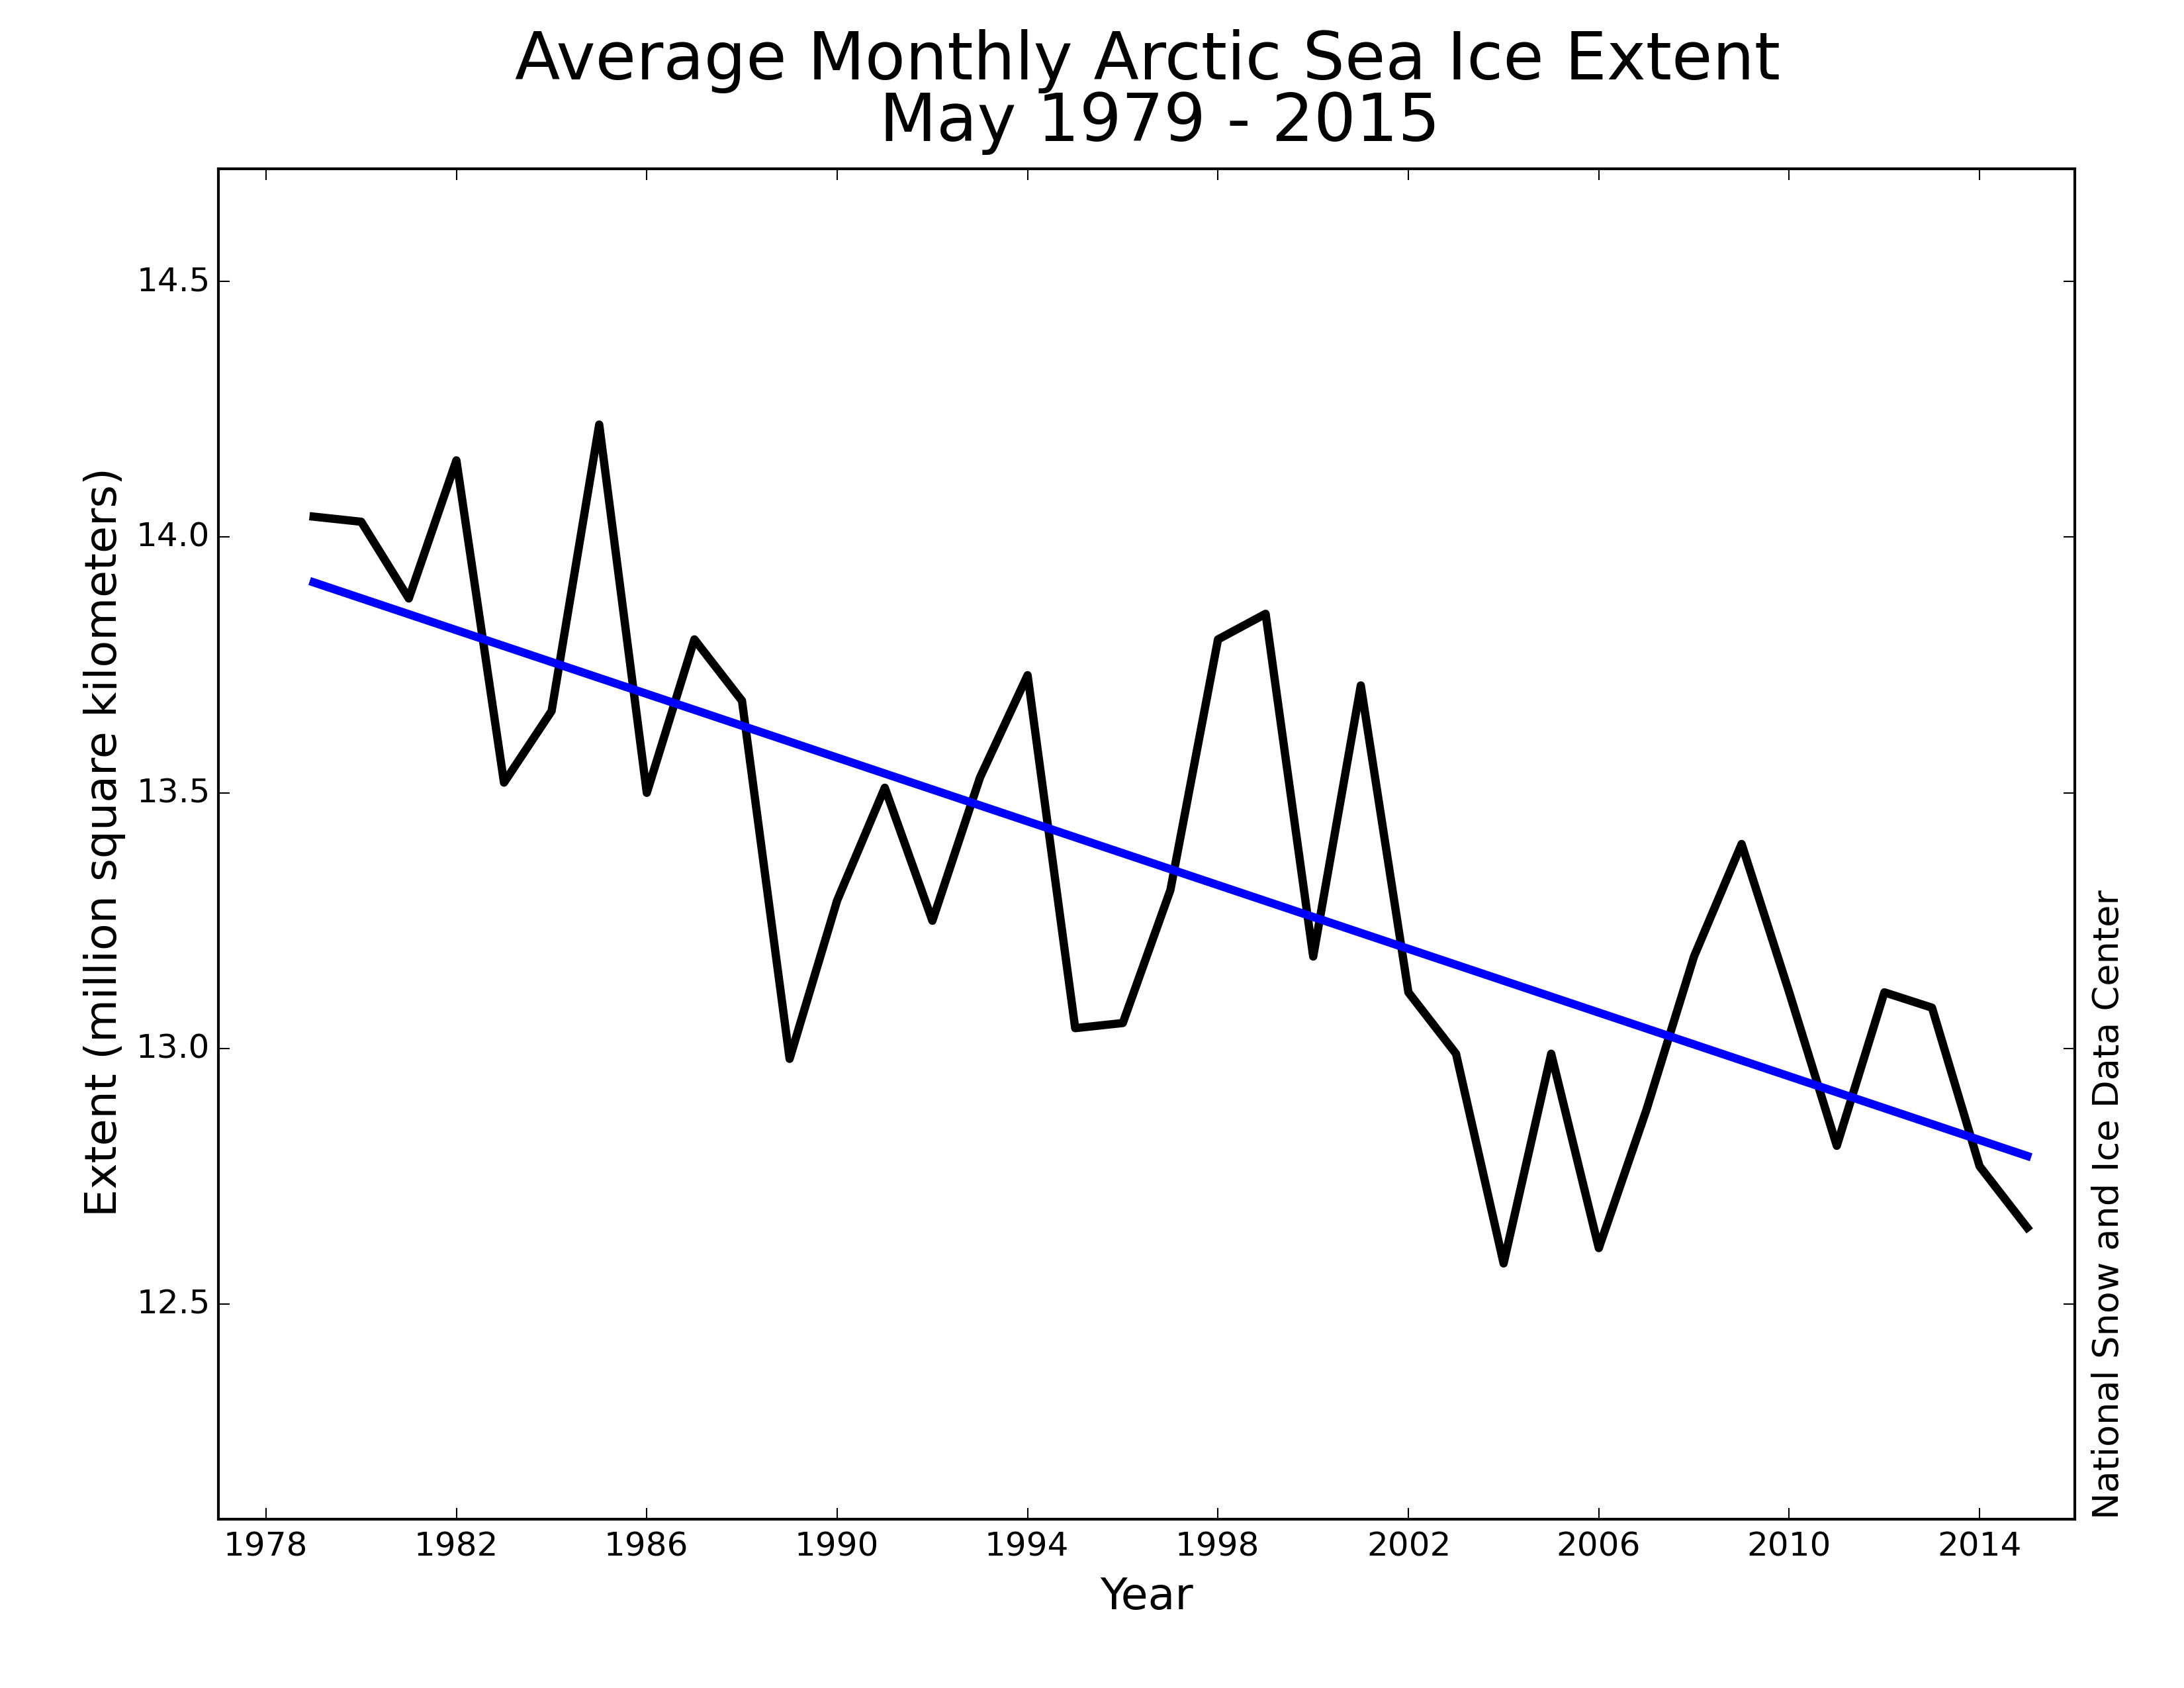
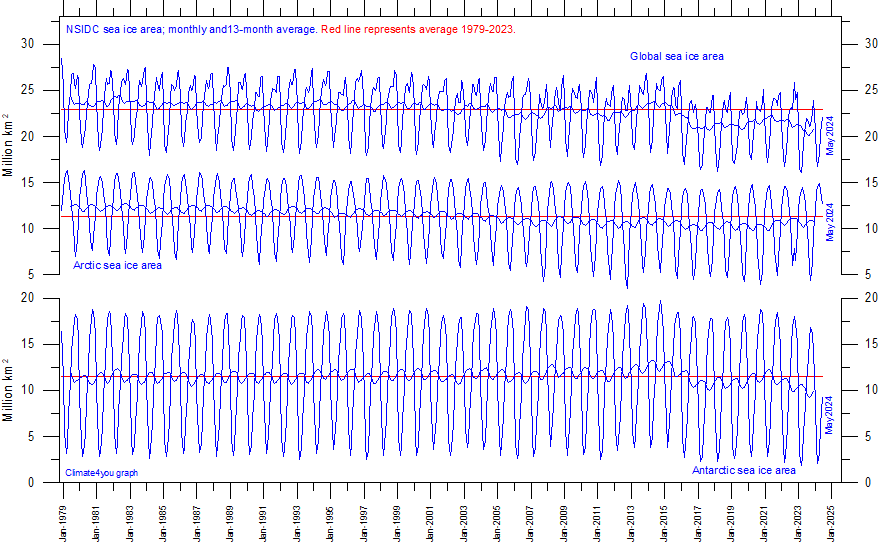
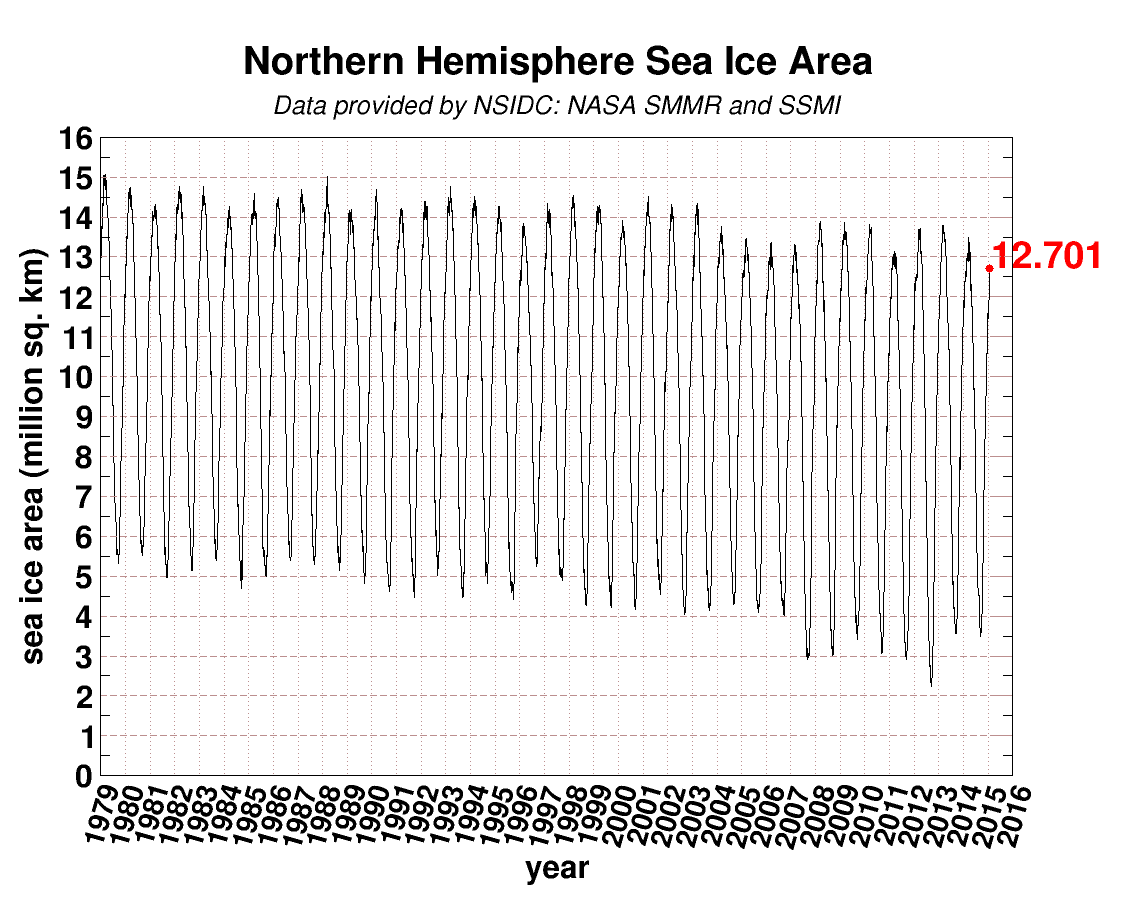
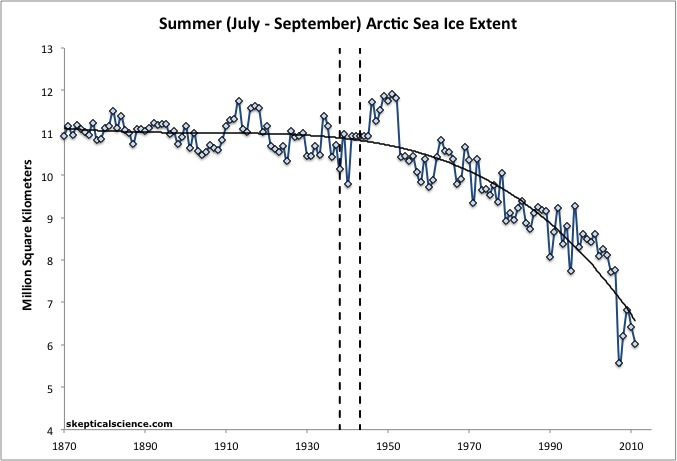
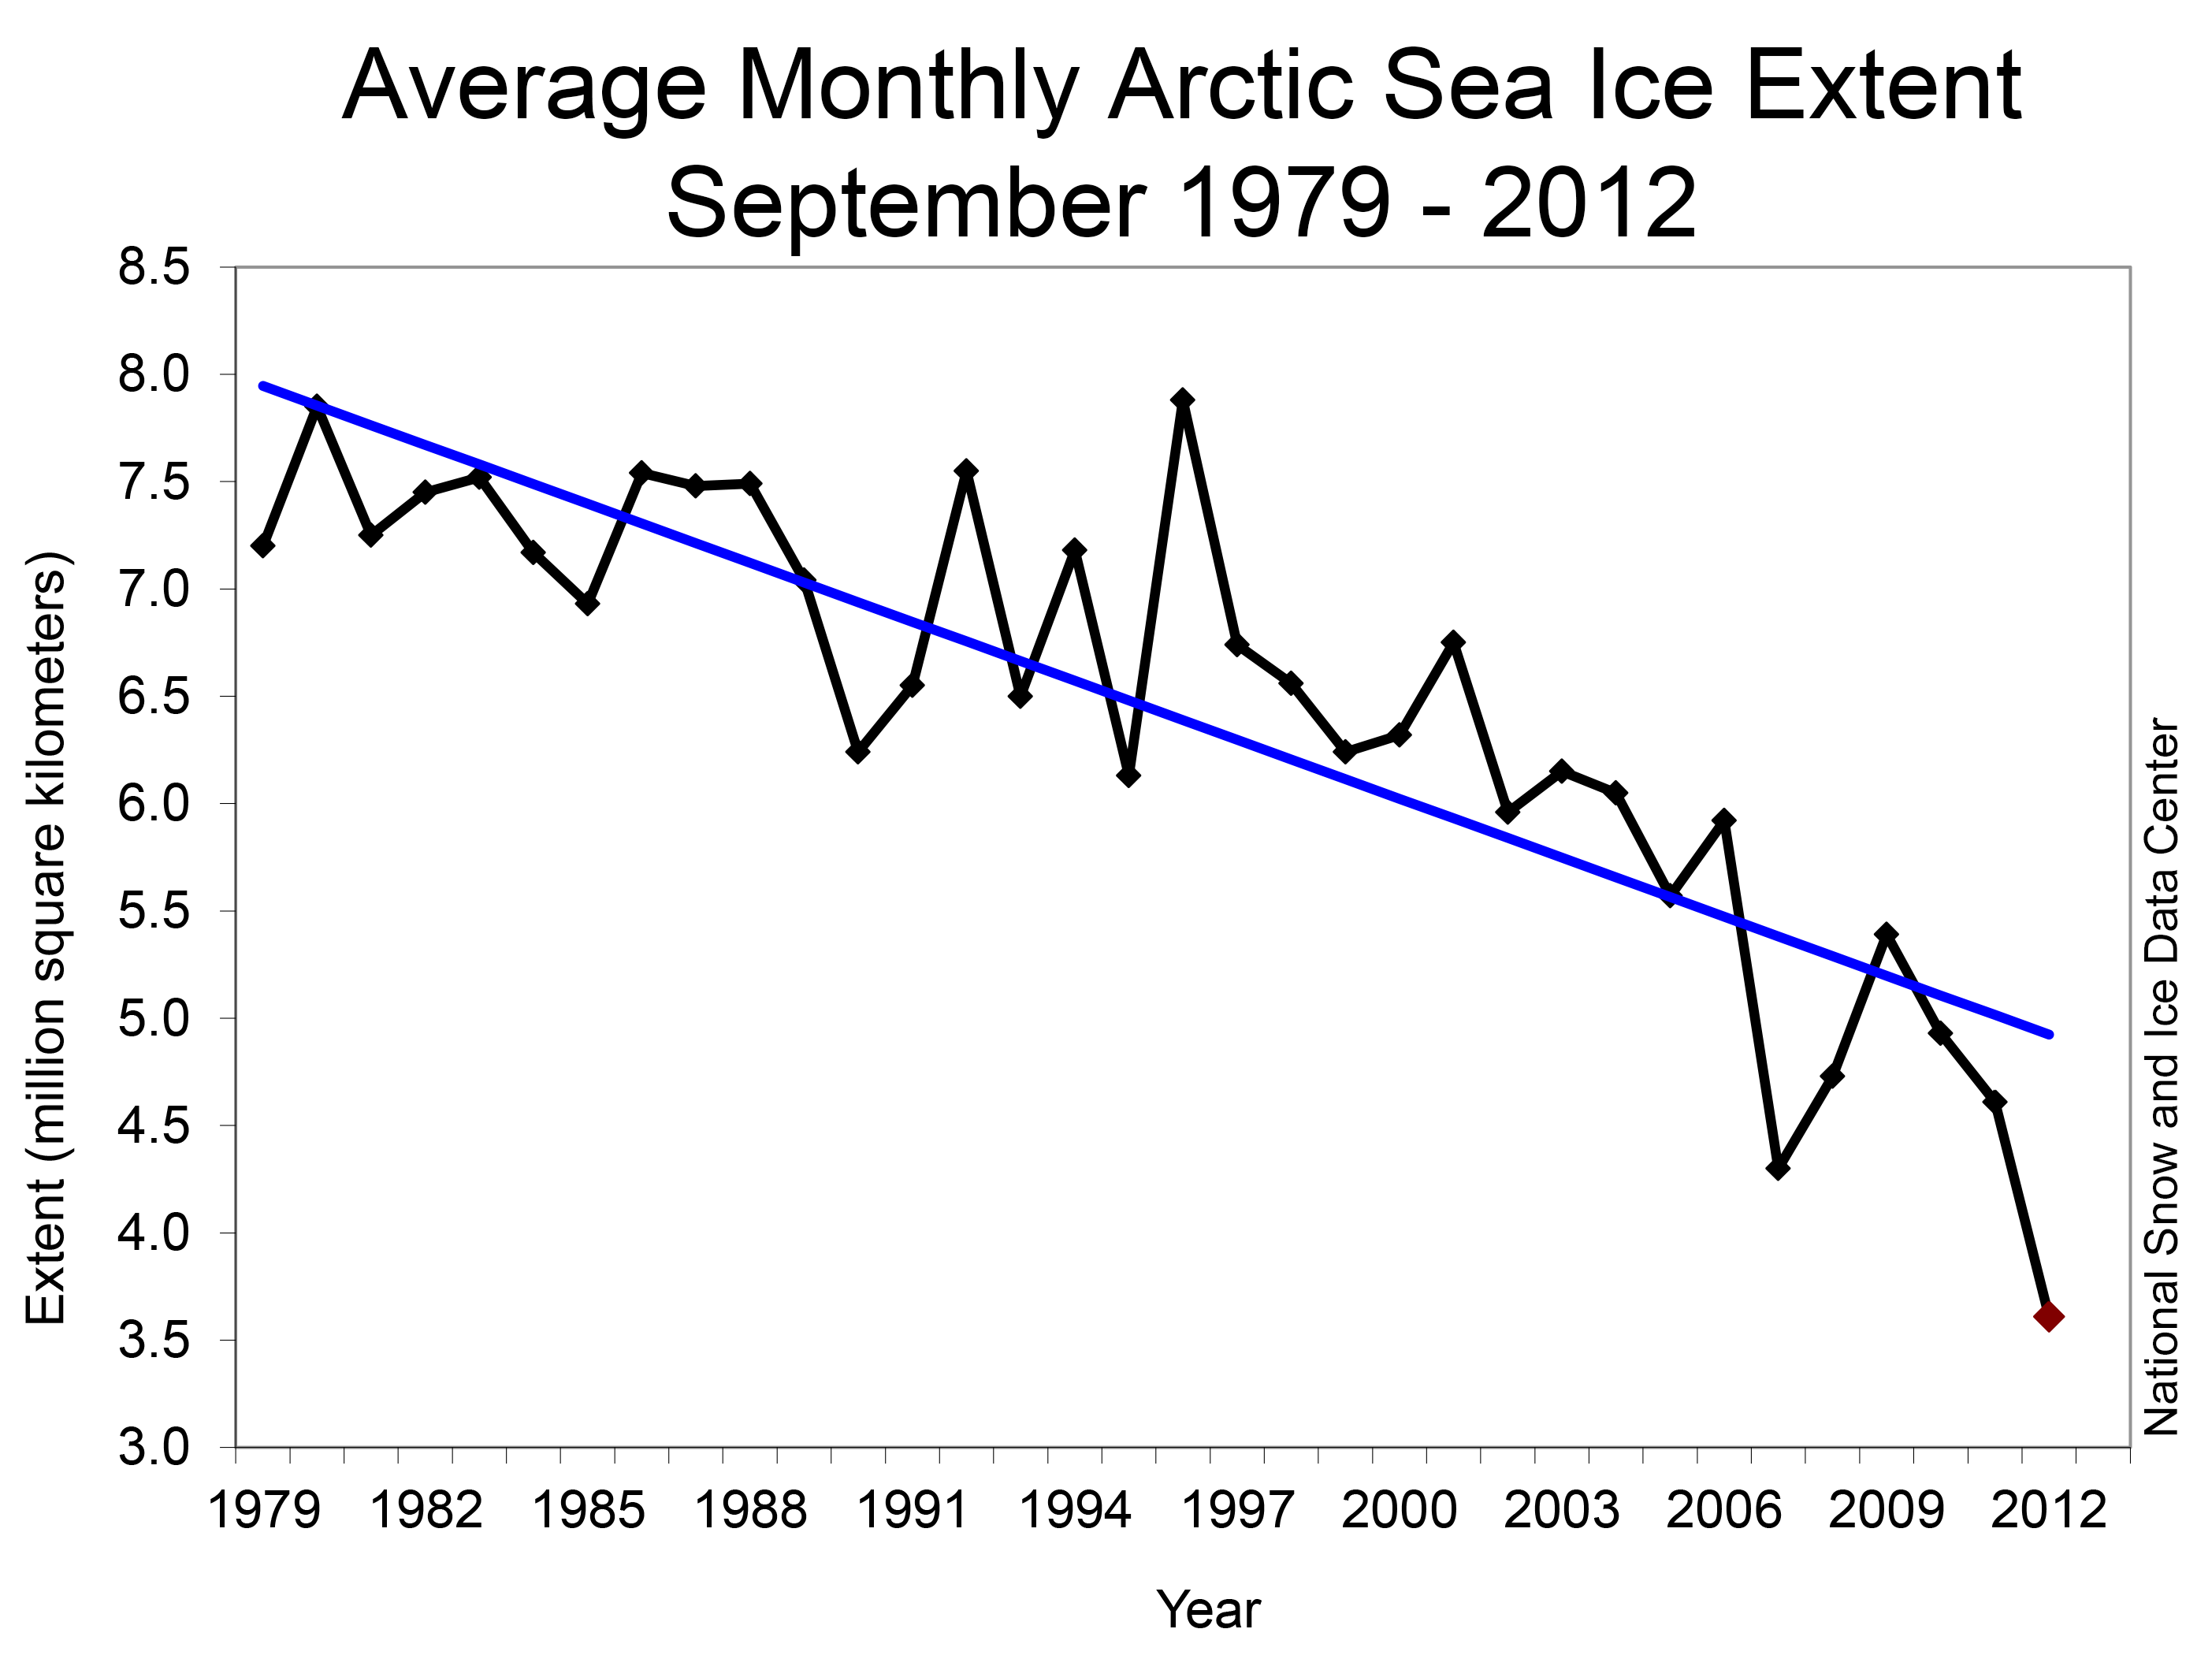
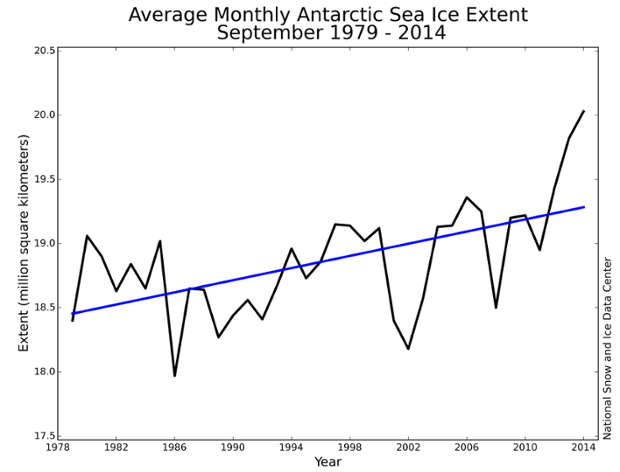
Recovery would be the slope of that line going the other way. And one of the graphs is volume, the other extent. Point is, there is quite a bit of variability, month to month and year to year. But for the last 36 years the lines, volume and extent, are sloping downward. Simple observable facts, observed by several satellites from different nations. Not models. Sorry that your alternative reality does not include what is happening here on this planet.