Being a liar and a fool, and an ignorant liar and fool at that, ain't no way to go through life son.
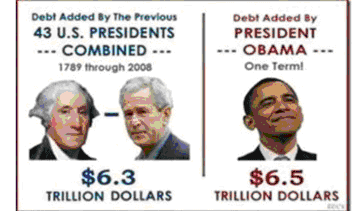
And it’s also untrue — as claimed in a graphic widely circulated by email and in social media postings — that the debt has increased more under Obama than under all previous 43 presidents combined. In fact, as of Jan. 31, 2012, the rise under Obama had yet to surpass the rise under his predecessor, George W. Bush.
The figures in that graphic are pure fabrications, as anyone can easily confirm by plugging Obama’s inauguration date — Jan. 20, 2009 — in the Treasury Department’s handy “
debt to the penny” website. That shows the nation’s total debt stood at $10.6 trillion on the day Obama took office (not $6.3 trillion), and it had increased to nearly $15.4 trillion by the end of January 2012 — a rise of more than $4.7 trillion in just over three years (not $6.5 trillion).
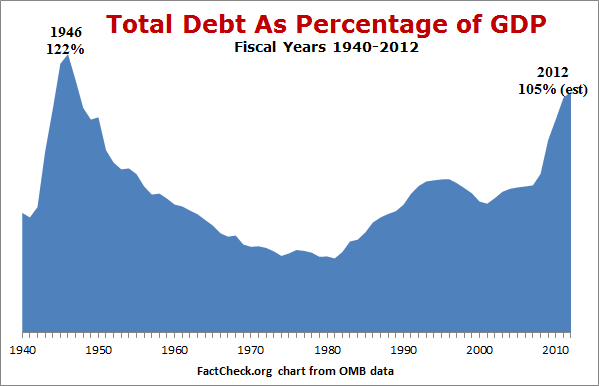
In this chart, which we generated from the most recent historical data and projections (
Table 7.1) from the Office of Management and Budget, it can be seen that the total federal debt in relation to the economy is reaching historically high levels — approaching levels not seen since World War II. But it can also be seen that the rise started long before Obama took office.
In fact, the upward trend began with Ronald Reagan’s fiscal 1982 budget, declined somewhat from fiscal 1997 through 2001, and resumed the upward climb with George W. Bush’s first budget in fiscal 2002 (which started Oct. 1, 2001).
And the rise accelerated as the economy slid into the worst recession since the Great Depression,
starting in December 2007. As the economy shrank, the debt-to-GDP ratio jumped 5 percentage points in the fiscal year that started Oct. 1, 2007, and another 14.8 percentage points during the following year. Obama took office nearly one-third of the way into that 12-month period. At the time, the nonpartisan
Congressional Budget Office was projecting the deficit for that fiscal year would be $1.2 trillion