First direct observation of carbon dioxide's greenhouse effect at Earth's surface

orogenicman

Darwin was a pastafarian
Jul 24, 2013
8,546
834
175
Confirmed at last. All they have to do now is reproduce the results at many more locations. Any deniers care to respond?

http://www.sciencedaily.com/releases...0225132103.htm


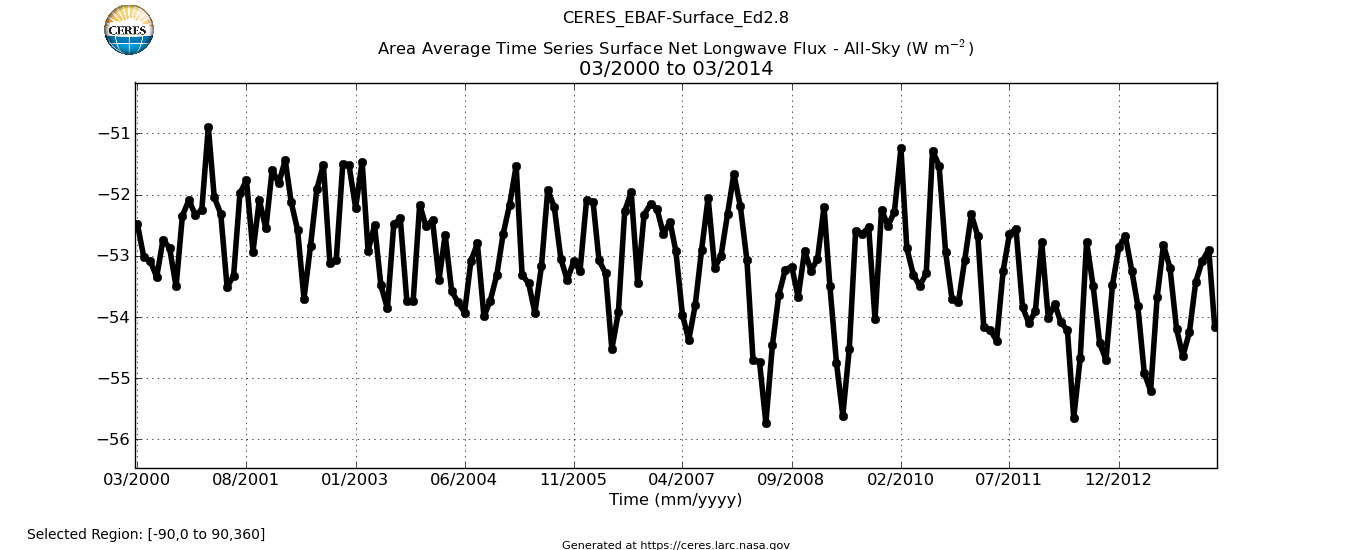
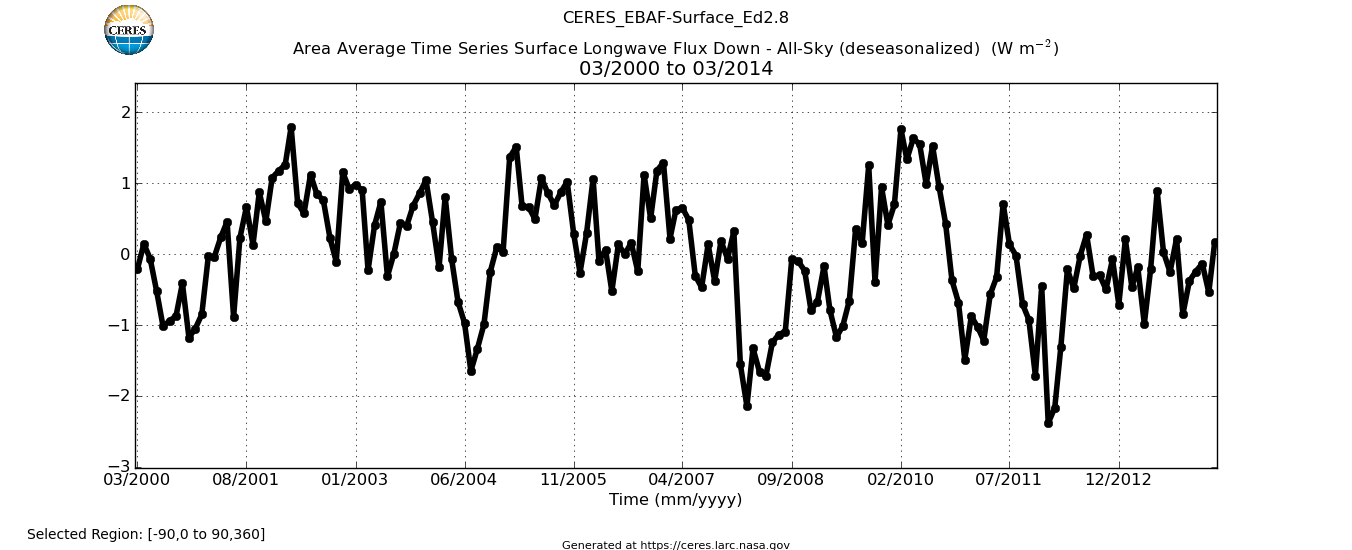
Scientists have observed an increase in carbon dioxide's greenhouse effect at Earth's surface for the first time. They measured atmospheric carbon dioxide's increasing capacity to absorb thermal radiation emitted from Earth's surface over an 11-year period at two locations in North America. They attributed this upward trend to rising carbon dioxide levels from fossil fuel emissions.
More at the link.

Also, a video:


The graph does NOT show an increase of temperature all it shows is more CO2 which we already know. Further the graph and the supposed study does not prove that the increase was man made.

Where is the test that establishes that the amount of CO2 increase in the earths atmosphere caused any warming at all? No one has done one, no one is planning to do one and that proves that you dumb asses know it can not be proven.

I am assuming that you did not read the paper. Read the paper!

You didn't read it. It merely assumes the 22 ppm of co2 is all anthropogenic

They stopped the test in 2010 and they're reporting the results 5 years later?????
 
In any event we have an 800000 year data set showing co2 lagging temperature, is modern co2 different?
 
150225132103-large.jpg

The scientists used spectroscopic instruments operated by the Department of Energy's Atmospheric Radiation Measurement (ARM) Climate Research Facility. This research site is on the North Slope of Alaska near the town of Barrow. They also collected data from a site in Oklahoma.

The scientists measured atmospheric carbon dioxide's contribution to radiative forcing at two sites, one in Oklahoma and one on the North Slope of Alaska, from 2000 to the end of 2010. Radiative forcing is a measure of how much the planet's energy balance is perturbed by atmospheric changes. Positive radiative forcing occurs when Earth absorbs more energy from solar radiation than it emits as thermal radiation back to space. It can be measured at Earth's surface or high in the atmosphere. In this research, the scientists focused on the surface.

They found that CO2 was responsible for a significant uptick in radiative forcing at both locations, about two-tenths of a Watt per square meter per decade. They linked this trend to the 22 parts-per-million increase in atmospheric CO2 between 2000 and 2010. Much of this CO2 is from the burning of fossil fuels, according to a modeling system that tracks CO2 sources around the world.

"We see, for the first time in the field, the amplification of the greenhouse effect because there's more CO2 in the atmosphere to absorb what the Earth emits in response to incoming solar radiation," says Daniel Feldman, a scientist in Berkeley Lab's Earth Sciences Division and lead author of the Nature paper.

First direct observation of carbon dioxide s increasing greenhouse effect at Earth s surface -- ScienceDaily

Pretty definitive experiment validating exactly what has been predicted.

Yep.. A whopping 0.02W/M^2 increase per decade and no proof of attribution(forget that they totued a 3.7W/M^2 per decade... Exaggeration is the name of the game). They measured something and then they failed to meet any scientific requirements showing equipment used and error bars. I will withhold further judgement until they release their data, methodology, and math.

Looking at the article they are making wild assumptions about a great many things. But this is what I have come to expect from alarmists and BEST. Its such a weak link that I doubt it has any merit as they did not rule out other input sources.
 
Last edited:
No, Billy Boob, don't pretend you have the ability to make heads or tails of the science that the scientists will present. You have demonstrated that lack amply on this on this board.
 
Would CO2 forcing correlate well with CERES radiation measurements? Given what BEST is crying aloud with this new so called revelation what do other monitoring devices and programs see?

"In fact, it doesn’t correlate at all. Globally, Earth’s surface has strongly strengthened its ability to cool radiatively from 2000 to 2014 (by about 1.5 W/m2 or ~1 W/m2 per decade) according to CERES:


(Note, absolute values, negative means LARGER surface heat loss.)

Not much trace there of any increasing atmospheric retardation of outgoing surface radiative heat, is there? Rather the opposite …

And if you think this is only because the surface has warmed somewhat and so radiates more, think again. Here’s global DWLWIR (“atmospheric back radiation”) over that same period:


(Note, anomalies, negative values mean LESS in.)

Down by ~1 W/m2.

And this is in spite of significantly increasing atmospheric content of both CO2 and H2O (WV & clouds) + allegedly rising temps since 2000.

Go figure …"


So the answer to my question is emphatically, NO! Looks like BEST is pulling things out of their collective asses.. Again!

Source
 
Last edited:
No, Billy Boob, don't pretend you have the ability to make heads or tails of the science that the scientists will present. You have demonstrated that lack amply on this on this board.

Actually, I have had a preprint copy of BEST's latest work for about a week now. Been looking hard at many of their assumptions. Should have the Data, Methods and Math by Friday to begin a full evaluation of their work. Looking forward to tearing it to shreds.
 
Given the CERES information, BEST has made some serious mistakes in their assessments, it would appear. But again, I will hold off on total dismissal until I can evaluate the works.
 
The graph does NOT show an increase of temperature all it shows is more CO2 which we already know. Further the graph and the supposed study does not prove that the increase was man made.

Where is the test that establishes that the amount of CO2 increase in the earths atmosphere caused any warming at all? No one has done one, no one is planning to do one and that proves that you dumb asses know it can not be proven.
That you are incapable of understanding that this is exactly what the experiment has done is simply another demonstration of the sad state of ignorance of the deniers here.

Where else is the increase in CO2 coming from? Not only do we have measurements of the output of volcanos by the USGS, but we also know, from the amount of fossil fuels burned, how much CO2 man is putting into the atmosphere. Best address that issue, Sgt., and then get back to us.
 
150225132103-large.jpg

The scientists used spectroscopic instruments operated by the Department of Energy's Atmospheric Radiation Measurement (ARM) Climate Research Facility. This research site is on the North Slope of Alaska near the town of Barrow. They also collected data from a site in Oklahoma.

The scientists measured atmospheric carbon dioxide's contribution to radiative forcing at two sites, one in Oklahoma and one on the North Slope of Alaska, from 2000 to the end of 2010. Radiative forcing is a measure of how much the planet's energy balance is perturbed by atmospheric changes. Positive radiative forcing occurs when Earth absorbs more energy from solar radiation than it emits as thermal radiation back to space. It can be measured at Earth's surface or high in the atmosphere. In this research, the scientists focused on the surface.

They found that CO2 was responsible for a significant uptick in radiative forcing at both locations, about two-tenths of a Watt per square meter per decade. They linked this trend to the 22 parts-per-million increase in atmospheric CO2 between 2000 and 2010. Much of this CO2 is from the burning of fossil fuels, according to a modeling system that tracks CO2 sources around the world.

"We see, for the first time in the field, the amplification of the greenhouse effect because there's more CO2 in the atmosphere to absorb what the Earth emits in response to incoming solar radiation," says Daniel Feldman, a scientist in Berkeley Lab's Earth Sciences Division and lead author of the Nature paper.

First direct observation of carbon dioxide s increasing greenhouse effect at Earth s surface -- ScienceDaily

Pretty definitive experiment validating exactly what has been predicted.

Yep.. A whopping 0.02W/M^2 increase per decade and no proof of attribution(forget that they totued a 3.7W/M^2 per decade... Exaggeration is the name of the game). They measured something and then they failed to meet any scientific requirements showing equipment used and error bars. I will withhold further judgement until they release their data, methodology, and math.

Looking at the article they are making wild assumptions about a great many things. But this is what I have come to expect from alarmists and BEST. Its such a weak link that I doubt it has any merit as they did not rule out other input sources.

Erm, did you not see the image of the equipment, above? And that's 0.2W/M^2 per decade averaged out over the whole planet, dude, not 0.02.

What wild assumptions are you claiming that they are making? Simply making a wild assed accusation doesn't get it.

Even at 0.2W/M^2 it is statistically insignificant. Given that Oklahoma was measured 2.5 times per day and the arctic was measured just one time per day there are serious error bar issues. Not to mention that they targeted DWLWIR in specific bands only and did not consider other factors such as water vapor and its interactions.

Simple convection effects can completely swamp any tiny radiative changes, and that doesn’t require decades of data fiddling, name calling, bad science, government grants, increased taxes, etc. This paper appears to be a hope and poke by Berkley Earth Sciences.
 
The TSI has declined slightly in the last few years, we had record years for heat in 1998, 2005, 2010, and 2014. 9 of the 10 hottest years on record have been since 2010. That agrees with exactly what the scientists saw with their instruments.
 

Forum List

Back
Top