Damn, that is a lot of Ice out in the Arctic.

View attachment 95024

greenland_melt_area_plot_tmb.png

Although nearly keeping pace with 2012 in May and June, surface melting on Greenland in July did not match the extreme area of melting seen in 2012, and has generally remained near the 2015 levels. Melting occurred more frequently than average (relative to Julys spanning 1981 to 2010) along the northern half of the ice sheet. Meanwhile, the southern half had above-average melt near the coast, and less frequent surface melting in higher elevations. However, in mid-August several days of extensive southern melting have been observed, which will add to that melting total at season’s end. The largest melt extent observed (using the Mote method based on satellite data) was 43 percent of the ice sheet, on July 19. As of August 15, the 2016 cumulative melt area was just over half of the 2012 area at the same date.

Greenland Ice Sheet Today | Surface Melt Data presented by NSIDC

Silly asses denying what the scientists are observing.
Hey Old Crook...did you hear? The polar bear is now extinct.

OOOOOOOOOOOOOOHHHHHHHHHHHHHHHHHH NNNNNNNOOOOOOOOOOOOOOOOOOO!!!!!!
1336046220179_the%20scream.jpg
 
Nobody can take the science presented by NASA seriously in 2016..........we've just established that these people are rigging the data on temperature. Its not even debatable ( there's a whole thread on it currently in here ).:popcorn:


And PS.....as per usual, the alarmist guys always post up the graphs that make their shit look good, in this case, Greenland ice over a long period of time. But if you take a close look :deal: 
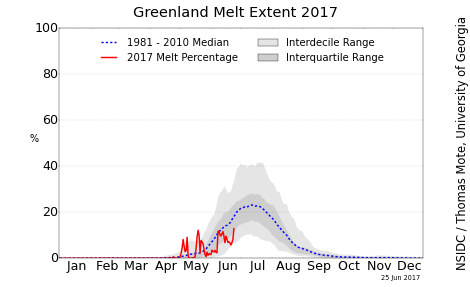
you see that over the last 4 years, Greenland ice is expanding >>>>

WRONG AGAIN: Greenland’s Ice Sheet Defies Critics With 4-Year High
 
And lets not forget something that is also not debatable........in 2016, nobody is giving a shit about the ice.........like anywhere.........they've been seeing this play for decades now and to the public, its has become like watching paint dry.:popcorn:And this is after a 2 decade alliance with the media on this crap..........the snooze level could not be more pronounced.


Look at this forum............nobody comes in here. Over the last 5 years, how many new alarmist guys are regulars in here? The answer is exactly zero!! Three or four regulars and a stop ion for a cup of coffee from 3 or 4 other nutter progressives. Nobody is caring.........
 
670398main_greenland_2012194-673.jpg

Extent of surface melt over Greenland’s ice sheet on July 8 (left) and July 12 (right). Measurements from three satellites showed that on July 8, about 40 percent of the ice sheet had undergone thawing at or near the surface. In just a few days, the melting had dramatically accelerated and an estimated 97 percent of the ice sheet surface had thawed by July 12. In the image, the areas classified as “probable melt” (light pink) correspond to those sites where at least one satellite detected surface melting. The areas classified as “melt” (dark pink) correspond to sites where two or three satellites detected surface melting. The satellites are measuring different physical properties at different scales and are passing over Greenland at different times. As a whole, they provide a picture of an extreme melt event about which scientists are very confident. Credit: Nicolo E. DiGirolamo, SSAI/NASA GSFC, and Jesse Allen, NASA Earth Observatory
› Hi-res of left image
› Hi-res of right image


NASA - Satellites See Unprecedented Greenland Ice Sheet Surface Melt
dude, this is hillarious. just fking hilarious. ever watch ice melt in full sun? It takes awhile. I doubt four days is enough time. but I see you believe. well, I'll just laugh at your stupid. because, that's hilarious there.
 
Well now, dumb fuck, no cruise ship of that size has ever gone through the Northwest Passage before.
Only because the cruise ship industry has grown, dufus. Tankers and cargo ships have been sailing those waters for decades.

Just another example of how you chicken littles twist the facts to support your cult of lies.
What a damned liar you are, Weatherman.

Cargo Ship Makes 1st-Ever Solo Trip Through Northwest Passage

The first cargo ship to sail through the Northwest Passage completed the route in September 2013, with an icebreaker escort from the Canadian Coast Guard. And in 2012, a Russian ship sailed from Norway eastward to Japan. Cruise ships and personal yachts have also successfully made the voyage, some unassisted.
"McClure Strait was finally conquered in 1954 by U.S. Navy and Coast Guard icebreakers. Three U.S. Coast Guard cutters, the Spar, the Bramble and the Storis, aided by the Canadian Navy icebreaker Labrador, made the first west to east trip in 1957. They traveled through the Bellot Strait. This narrow channel is big enough for freighters. It permits cargo ships to unload supplies for the Distant Early Warning radar line in northern Canada."
Who was the first to sail the northwest passage? - You Ask Andy
I find it hilarious, that ice breakers are used to open up the passage ways. Doesn't that make ice melt faster by moving it, exposing it and breaking it up? I mean, how fking stupid are these dems?
 
Glaciers today, are growing.
Alaska’s Glaciers Are Retreating
Although the mechanisms vary, together the glaciers are losing 75 billion tons of ice annually

Since the 1990s, the retreat of glaciers in Alaska has made a disproportionally large contribution to global sea-level rise. The USGS reports that the state’s glaciers are losing 75 billion tons of ice annually, equal to the amount of water needed to fill Yankee Stadium 150,000 times each year

Alaska's Glaciers Are Retreating

Now that does not look like the glaciers are growing.
In 1794 Vancouver charted the location of Glacier Bay glacier and its thickness of 3,900 feet. When John Muir went there in 1888 the glacier had receded 44 miles into the bay.
Glacier Bay Basin - Wikipedia

It happens at the end of ice ages, dufus.
 
Extent of surface melt over Greenland’s ice sheet on July 8 (left) and July 12 (right). Measurements from three satellites showed that on July 8, about 40 percent of the ice sheet had undergone thawing at or near the surface. In just a few days, the melting had dramatically accelerated and an estimated 97 percent of the ice sheet surface had thawed by July 12. In the image, the areas classified as “probable melt” (light pink) correspond to those sites where at least one satellite detected surface melting. The areas classified as “melt” (dark pink) correspond to sites where two or three satellites detected surface melting. The satellites are measuring different physical properties at different scales and are passing over Greenland at different times. As a whole, they provide a picture of an extreme melt event about which scientists are very confident. Credit: Nicolo E. DiGirolamo, SSAI/NASA GSFC, and Jesse Allen, NASA Earth Observatory
› Hi-res of left image
› Hi-res of right image


NASA - Satellites See Unprecedented Greenland Ice Sheet Surface Melt
How many ways can something melt?
1. Surface Melt
2. Probable Melt
3. Surface Melting
4. Melt
5. Extreme Melt
6. Melting

Seriously, fire these Morons. They are a waste of our money. Six different types of Melting? Measured by three different satellites? At what cost? Millions of Dollars! And when all is said and done, the Ice Sheet covering Greenland is growing, not melting!
 
It's mainly because you don't understand the science, but don't let that get in the way of you making a fool out of yourself.
Well, go ahead and explain the Science, of Big Ice Cubes growing you fucking moron.

Oh, wow, insults.
yes, you gave insults and I made a point, that makes you a moron, which is not an insult, simply how you presented yourself. Maybe next time you should add content and not flame and troll.

They do what they can do...they have no content that actually makes their point...it must be tough to hold a position so strongly and argue in support of it when you have no observed, measured, quantified, empirical evidence in support of it....if they are going to take that position, they don't have many options beyond insult, and terribly misrepresented, and altered data.
 
Arctic Sea Ice News and Analysis | Sea ice data updated daily with one-day lag

The Arctic Ice continues in record low extant for this time of year, and the temperatures in the Arctic are at record highs. In fact both the Arctic Sea Ice, and the Antarctic Sea Ice are below two standard deviations.
Liar liar pants on fire! Old Crock is a fucking LIAR! First off, what does Old Crock mean by, "record low extant"? Does the moron mean, "extent".

Nowhere on this page that old crock linked to does it state what Old Crock states. Old Crock is Liar.
 
Quotes from NSIDC

Arctic sea ice extent during September 2016 averaged 4.72 million square kilometers (1.82 million square miles), the fifth lowest in the satellite record. Average September extent was 1.09 million square kilometers (421,000 square miles) above the record low set in 2012, and 1.82 million square kilometers (703,000 square miles) below the 1981 to 2010 long-term average. Extent remains especially low in the Beaufort, Chukchi and East Siberian Seas. The Northern Sea Route along the Russian coast appears to still be open, but the southern Northwest Passage route (Amundsen’s route) appears to be closed.

Through 2016, the linear rate of decline for September is 87,200 square kilometers (33,700 square miles) per year, or 13.3 percent per decade. While the absolute seasonal minimum for 2016 was tied with 2007 as second lowest, the average extent for the month of September 2016 of 4.72 million square kilometers (1.82 million square miles) ends up being fifth lowest in the satellite record, behind both 2012 and 2007. This reflects the rapid growth of ice following the seasonal minimum recorded on September 10.

The winter of 2015/2016 was extremely warm over the Arctic Ocean. The maximum sea ice extent in March set a new low in the satellite record, barely beating out March 2015. Extent for the month of March as a whole ended up second lowest on record. In April, problems with the F-17 sensor forced a temporary cessation of sea ice updates until data from the newer F-18 satellite could be brought online. Data from other sources documented that during this time, ice was still tracking very low. The months of May and June set more record lows in ice extent.

Age is another indicator of the state of sea ice because older ice is generally thicker ice (Tschudi et al., 2016). As mentioned in previous posts, there has been an overall decline in ice age, particularly the oldest ice types—ice that has been in the Arctic for more than four years. Near-real-time updates (which are preliminary) indicate that at this year’s minimum, only 106,000 square kilometers (41,000 square miles) of 4+ year old ice remained, or 3.1 percent of the total ice extent. This is in stark contrast to the mid-1980s when over 2 million square kilometers (33 percent, or 772,000 square miles) of the summer minimum extent was composed of old ice that had survived at least four summer melt seasons.

PS: no adult says :"liar, liar, pants on fire".
 
Last edited:
Quotes from NSIDC

Arctic sea ice extent during September 2016 averaged 4.72 million square kilometers (1.82 million square miles), the fifth lowest in the satellite record. Average September extent was 1.09 million square kilometers (421,000 square miles) above the record low set in 2012, and 1.82 million square kilometers (703,000 square miles) below the 1981 to 2010 long-term average. Extent remains especially low in the Beaufort, Chukchi and East Siberian Seas. The Northern Sea Route along the Russian coast appears to still be open, but the southern Northwest Passage route (Amundsen’s route) appears to be closed.

Through 2016, the linear rate of decline for September is 87,200 square kilometers (33,700 square miles) per year, or 13.3 percent per decade. While the absolute seasonal minimum for 2016 was tied with 2007 as second lowest, the average extent for the month of September 2016 of 4.72 million square kilometers (1.82 million square miles) ends up being fifth lowest in the satellite record, behind both 2012 and 2007. This reflects the rapid growth of ice following the seasonal minimum recorded on September 10.

The winter of 2015/2016 was extremely warm over the Arctic Ocean. The maximum sea ice extent in March set a new low in the satellite record, barely beating out March 2015. Extent for the month of March as a whole ended up second lowest on record. In April, problems with the F-17 sensor forced a temporary cessation of sea ice updates until data from the newer F-18 satellite could be brought online. Data from other sources documented that during this time, ice was still tracking very low. The months of May and June set more record lows in ice extent.

Age is another indicator of the state of sea ice because older ice is generally thicker ice (Tschudi et al., 2016). As mentioned in previous posts, there has been an overall decline in ice age, particularly the oldest ice types—ice that has been in the Arctic for more than four years. Near-real-time updates (which are preliminary) indicate that at this year’s minimum, only 106,000 square kilometers (41,000 square miles) of 4+ year old ice remained, or 3.1 percent of the total ice extent. This is in stark contrast to the mid-1980s when over 2 million square kilometers (33 percent, or 772,000 square miles) of the summer minimum extent was composed of old ice that had survived at least four summer melt seasons.

PS: no adult says :"liar, liar, pants on fire".
p.s., crick is a moron
 
You made the claim. It's your responsibility to show the reference source.
 

Forum List

Back
Top