Arctic Ice Off on Good Start this Season.

flacaltenn

Diamond Member
Jun 9, 2011
67,573
22,953
2,250
Hillbilly Hollywood, Tenn
Watching the mad Canadian truckers defy death in their coast to coast protest -- it looks like a frozen tundra from Vancouver to Ottawa. And our low tonight in Middle Tenn is about the same as Saskatchewan, -- I decided to take a quick look at the Arctic Sea Ice extent at NSIDC (Nat Snow/Ice Data Center)

They buried the lead as usual on the MONTHLY chart -- said it was a good start -- but pulling up the chart that compares it to past years -- there's tiny bit MORE that COULD have been said.

arctic ice jan2020.png


Not ONLY did it have the highest Minimum pt this fall in 10 years, it's STILL ahead of the other 10 years as it builds to a peak. At this point in the curve, even ONE warm day can spoil it in SOME areas. But you generally dont get a warm day around the ENTIRE Arctic Ocean.
 
Watching the mad Canadian truckers defy death in their coast to coast protest -- it looks like a frozen tundra from Vancouver to Ottawa. And our low tonight in Middle Tenn is about the same as Saskatchewan, -- I decided to take a quick look at the Arctic Sea Ice extent at NSIDC (Nat Snow/Ice Data Center)

They buried the lead as usual on the MONTHLY chart -- said it was a good start -- but pulling up the chart that compares it to past years -- there's tiny bit MORE that COULD have been said.

View attachment 594148

Not ONLY did it have the highest Minimum pt this fall in 10 years, it's STILL ahead of the other 10 years as it builds to a peak. At this point in the curve, even ONE warm day can spoil it in SOME areas. But you generally dont get a warm day around the ENTIRE Arctic Ocean.
Funny how weather runs in cycles isn't it
 
Watching the mad Canadian truckers defy death in their coast to coast protest -- it looks like a frozen tundra from Vancouver to Ottawa. And our low tonight in Middle Tenn is about the same as Saskatchewan, -- I decided to take a quick look at the Arctic Sea Ice extent at NSIDC (Nat Snow/Ice Data Center)

They buried the lead as usual on the MONTHLY chart -- said it was a good start -- but pulling up the chart that compares it to past years -- there's tiny bit MORE that COULD have been said.

View attachment 594148

Not ONLY did it have the highest Minimum pt this fall in 10 years, it's STILL ahead of the other 10 years as it builds to a peak. At this point in the curve, even ONE warm day can spoil it in SOME areas. But you generally dont get a warm day around the ENTIRE Arctic Ocean.

Arctic was supposed to have been ice free since 2005, right
 
Funny how weather runs in cycles isn't it

EVERYthing runs in cycles that not a completely stable system. INCLUDING climate. And including probably Arctic sea ice.

We can only VERIFY sea ice on any accurate scale since satellites in 1979. HISTORICAL anecdotal evidence says that 1978 or so was a "relative high" for maybe 100 years.

You only need to look at the FOUR in a row Ice Ages in relatively recent climate history. They look like a classic "oscillating system". Maybe and quite probably, that's the NORM and our bleak future.
 
One of the great spike the football moments in the history of this forum was...when in 2012, the AGW kOOks in here were posting up satellite photos of the Artic ice with "here it comes!" captions and the next year the ice up there suddenly grew by like 50% by 2013!! :popcorn: :popcorn:

It was skeptic hysteria!!!!:iyfyus.jpg:
 
EVERYthing runs in cycles that not a completely stable system. INCLUDING climate. And including probably Arctic sea ice.

We can only VERIFY sea ice on any accurate scale since satellites in 1979. HISTORICAL anecdotal evidence says that 1978 or so was a "relative high" for maybe 100 years.

You only need to look at the FOUR in a row Ice Ages in relatively recent climate history. They look like a classic "oscillating system". Maybe and quite probably, that's the NORM and our bleak future.

The continuous satellite sea ice data goes back to 1972 NOT 1979.

"One of the first studies to establish a trend of sea ice growth and retreat was written by Claire Parkinson and Donald Cavalieri, both at NASA Goddard, who in 1989 published an analysis of the data collected by the Electrically Scanning Microwave Radiometer (ESMR, launched onboard NASA’s Nimbus 5 satellite on December 10, 1972) and its successor, the Scanning Multichannel Microwave Radiometer (SMMR, which was sent to space onboard NASA’s Nimbus 7 satellite on October 24, 1978)."

LINK
 
Watching the mad Canadian truckers defy death in their coast to coast protest -- it looks like a frozen tundra from Vancouver to Ottawa. And our low tonight in Middle Tenn is about the same as Saskatchewan, -- I decided to take a quick look at the Arctic Sea Ice extent at NSIDC (Nat Snow/Ice Data Center)

They buried the lead as usual on the MONTHLY chart -- said it was a good start -- but pulling up the chart that compares it to past years -- there's tiny bit MORE that COULD have been said.

View attachment 594148

Not ONLY did it have the highest Minimum pt this fall in 10 years, it's STILL ahead of the other 10 years as it builds to a peak. At this point in the curve, even ONE warm day can spoil it in SOME areas. But you generally dont get a warm day around the ENTIRE Arctic Ocean.
Funny how a lying little ass like you posts that and ignores this;
1643511421672.png

 
The continuous satellite sea ice data goes back to 1972 NOT 1979.

"One of the first studies to establish a trend of sea ice growth and retreat was written by Claire Parkinson and Donald Cavalieri, both at NASA Goddard, who in 1989 published an analysis of the data collected by the Electrically Scanning Microwave Radiometer (ESMR, launched onboard NASA’s Nimbus 5 satellite on December 10, 1972) and its successor, the Scanning Multichannel Microwave Radiometer (SMMR, which was sent to space onboard NASA’s Nimbus 7 satellite on October 24, 1978)."

LINK

My understanding is that all the Nimbuses prior to 7 were very limited in analysis capability. For instance, only the visual/IR images from earlier sats were truely useful could not discriminate between NEW ice and Old ice and therefore could not make analysis product for both SIExtent and SIConcentration.

I actually USED some of older Nimbus imagery to develop image processing algorithms and hardware. You rarely find ANY sea ice papers that EXTEND the continuous record SIExtent before 1978 and Nimbus 7. Must be a reason for that huh?
 

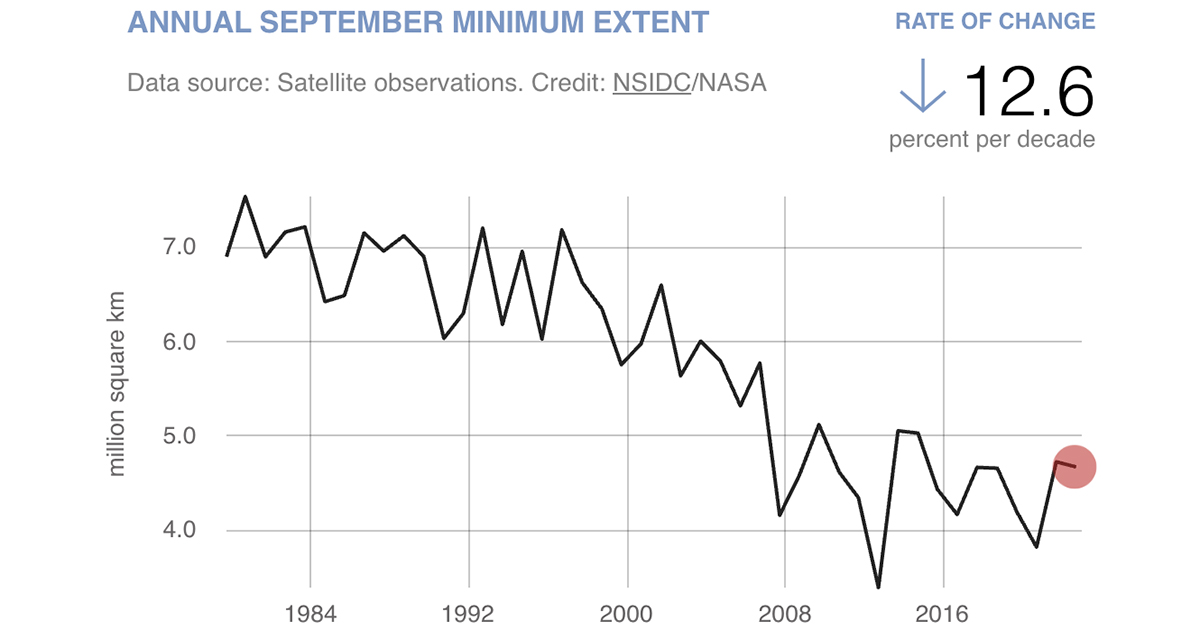
Shows right THERE in your graph that you can't read -- apparently. That rise at 2020 IS part of the indications of rebound.

IF YOU COULD read your graph -- you;d see that spike REVERSED 10 or 12 years of loss.from the mean trend line. Same thing I said in the Opost actually.

Also -- if you go look at Arctic Oscillation charts -- the NEGATIVE side of the Arctic Oscillation that builds ice got pretty much devasted for about 20 years and is REAPPEARING. So it's NOT just a ONE YEAR "weather" deal if the Pos/Neg oscillations ARE returning to some semblance of balance.

I'm gonna start filing libel suites on you for calling me "a lying ass" because you cant read a graph. Or put a $ in the cuss jar.
 
Last edited:
Watching the mad Canadian truckers defy death in their coast to coast protest -- it looks like a frozen tundra from Vancouver to Ottawa. And our low tonight in Middle Tenn is about the same as Saskatchewan, -- I decided to take a quick look at the Arctic Sea Ice extent at NSIDC (Nat Snow/Ice Data Center)

They buried the lead as usual on the MONTHLY chart -- said it was a good start -- but pulling up the chart that compares it to past years -- there's tiny bit MORE that COULD have been said.

View attachment 594148

Not ONLY did it have the highest Minimum pt this fall in 10 years, it's STILL ahead of the other 10 years as it builds to a peak. At this point in the curve, even ONE warm day can spoil it in SOME areas. But you generally dont get a warm day around the ENTIRE Arctic Ocean.
The Old cherry-picking and Withheld Link Dishonesty.

Top of the page - far right - we see a later graph from Jan 28th, Not your Jan 4.
And 2021/22 is now crossing/oscillating Below the 2012/2013 line...


LINK Arctic Sea Ice News and Analysis | Sea ice data updated daily with one-day lag

Like other years since you claimed warming ended.

Not that Arctic Ice is "Global" warming IAC.
It's possible to have the other poll or vaster areas warmer simultaneously.

1643516910345.png


Hmmmm.


And this thread went from 18 posts to 12.
I wish I could do that with my threads!


I love this internet debate stuff!
`
 
Last edited:

BTW GoldiRocks -- Are you looking at the vertical axis in your graph? It's

BTW: Can you explain to me WHY in the NSIDC chart I posted, at the end of December 2021 THAT chart says about 13 (million Km2). And why on the thing you posted Dec 2021 is ONLY at about 12,25 ?? Where'd you get this? Was it created AFTER end of December 2021 or before?

Or do they use MIDDLE of December for the monthly graphs? Because if pull for Jan 2021 it'll probably MORE agree with what I posted.
 

Funny how th efirst accuataction of lying goes along with a lie ... a lie of omission ... you're only using 40 years of data .. the previous 40 years is the opposite ... and you know it, lying sack of shit ...

Why a linear tread when forces follow parabolas? ... looks like the blue line in low in the beginning and high in the end ... like the graph is sinusoidal ... ha ha ha ha ha ha ha ... fucking liar ...

Obviously ... no refereed journal will publish NASA claims ... why would a liar not care? ...
 
My understanding is that all the Nimbuses prior to 7 were very limited in analysis capability. For instance, only the visual/IR images from earlier sats were truely useful could not discriminate between NEW ice and Old ice and therefore could not make analysis product for both SIExtent and SIConcentration.

I actually USED some of older Nimbus imagery to develop image processing algorithms and hardware. You rarely find ANY sea ice papers that EXTEND the continuous record SIExtent before 1978 and Nimbus 7. Must be a reason for that huh?

Nimbus 7 had additional sensors included over Nimbus 5, but both Nimbus satellites were designed to map the polar surface regions.

Nimbus 5

Electrically Scanning Microwave Radiometer (ESMR)


"The primary objectives of the Nimbus 5 Electrically Scanning Microwave Radiometer (ESMR) were (1) to derive the liquid water content of clouds from brightness temperatures over oceans, (2) to observe differences between sea ice and the open sea over the polar caps,..."

===

Nimbus 6

Electrically Scanning Microwave Radiometer (ESMR)


"The Nimbus 6 Electrically Scanning Microwave Radiometer (ESMR) measured the earth's microwave emission to provide the liquid water content of clouds, the distribution and variation of sea ice cover, and gross characteristics of land surfaces (vegetation, soil moisture, and snow cover)....."

===

Nimbus 7

Scanning Multispectral Microwave Radiometer (SMMR)


=====

All three Satellites measures sea ice concentration.

The IPCC thought the 1972-1978 were valid enough until it became political then they dropped it in later reports as if they don't exist at all.

1643566900249.png


LINK

1643567459759.png
 
Last edited:
Funny how th efirst accuataction of lying goes along with a lie ... a lie of omission ... you're only using 40 years of data .. the previous 40 years is the opposite ... and you know it, lying sack of shit ...

Why a linear tread when forces follow parabolas? ... looks like the blue line in low in the beginning and high in the end ... like the graph is sinusoidal ... ha ha ha ha ha ha ha ... fucking liar ...

Obviously ... no refereed journal will publish NASA claims ... why would a liar not care? ...
Now silly little dumb fuck. it is only the last 42 years in which we have had good satellite data. However, from historic records, here are some conclusions;

1643575370662.png

Results from the newly created 110-year record of Arctic sea ice volume show an unexplained slight decline (black line) in the early 20th century. The current drop (red line), caused by warming temperatures due to climate change, is more than six times as steep.Axel Schweiger/University of Washington


Forum List

Back
Top