We had this out just a couple of weeks ago. Short term memory loss? The statement was "as early as", not "no later than".
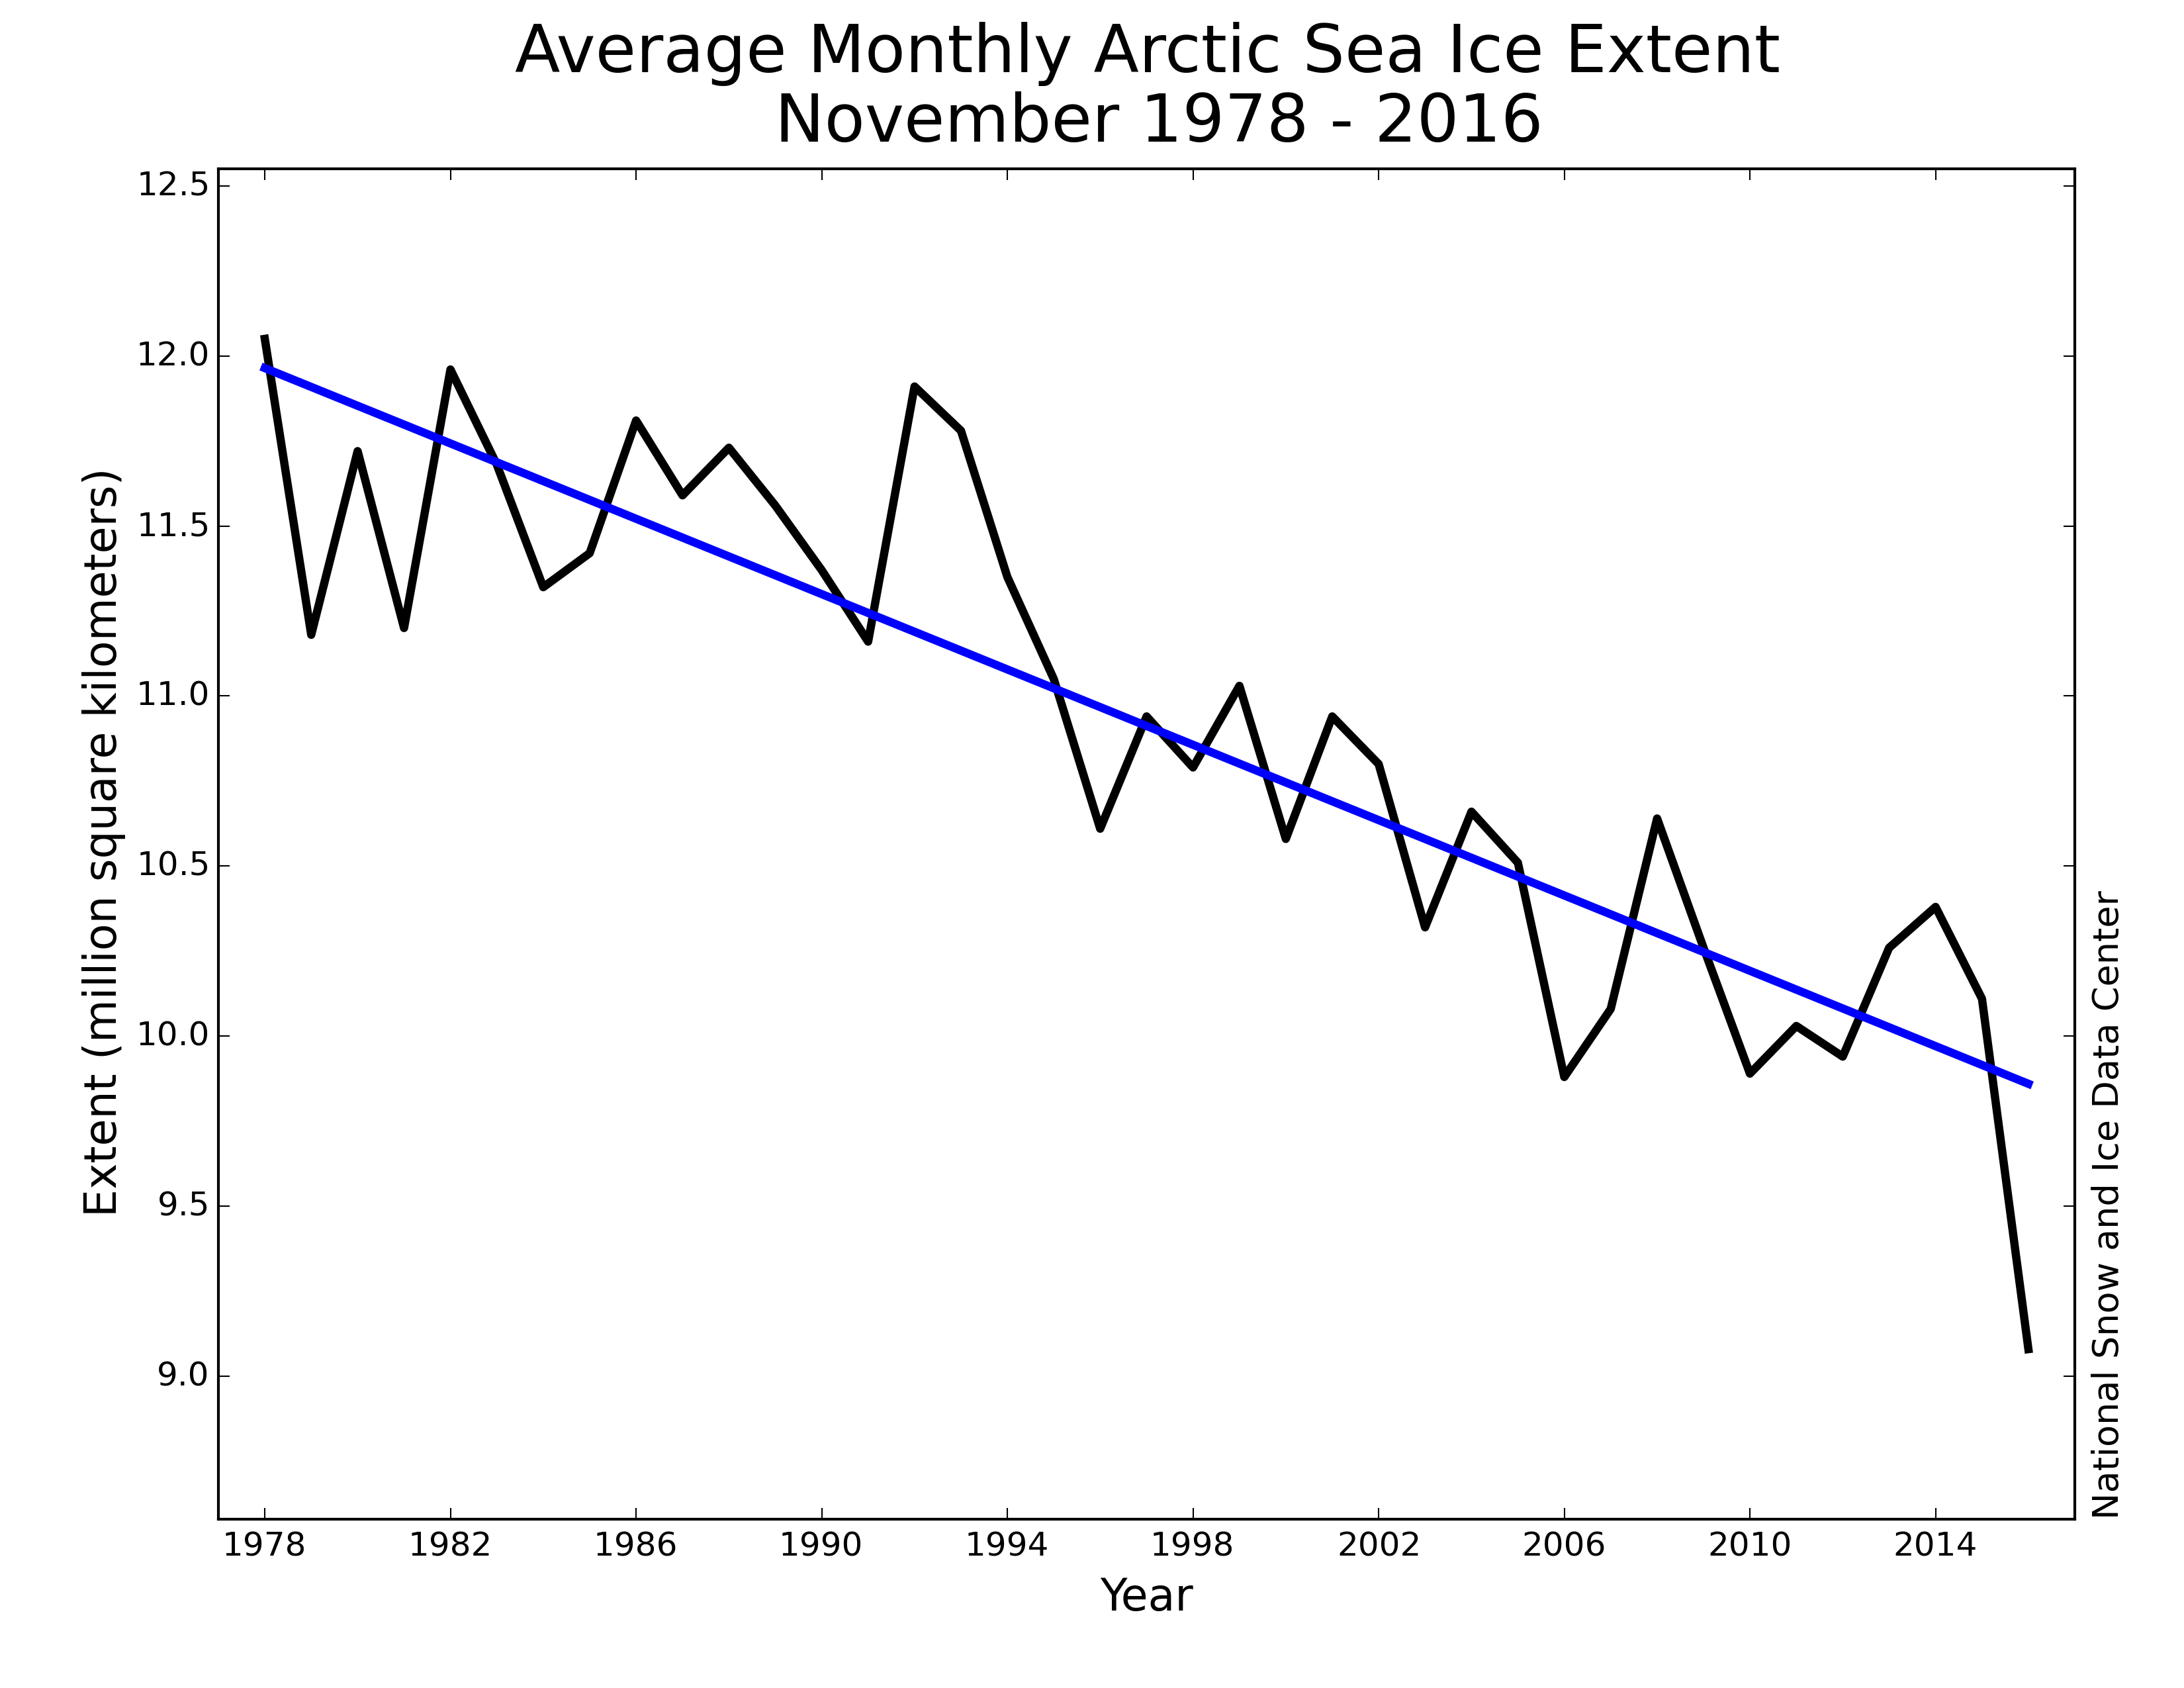
This data trend goes to zero in September of 2032. The 2 sigma span runs from 2023 to 2041. Do you think these data indicate ice is growing? By the way, the lower 2 sigma on the April trend indicate we could have a year round, ice-free Arctic before the end of the 21st century.
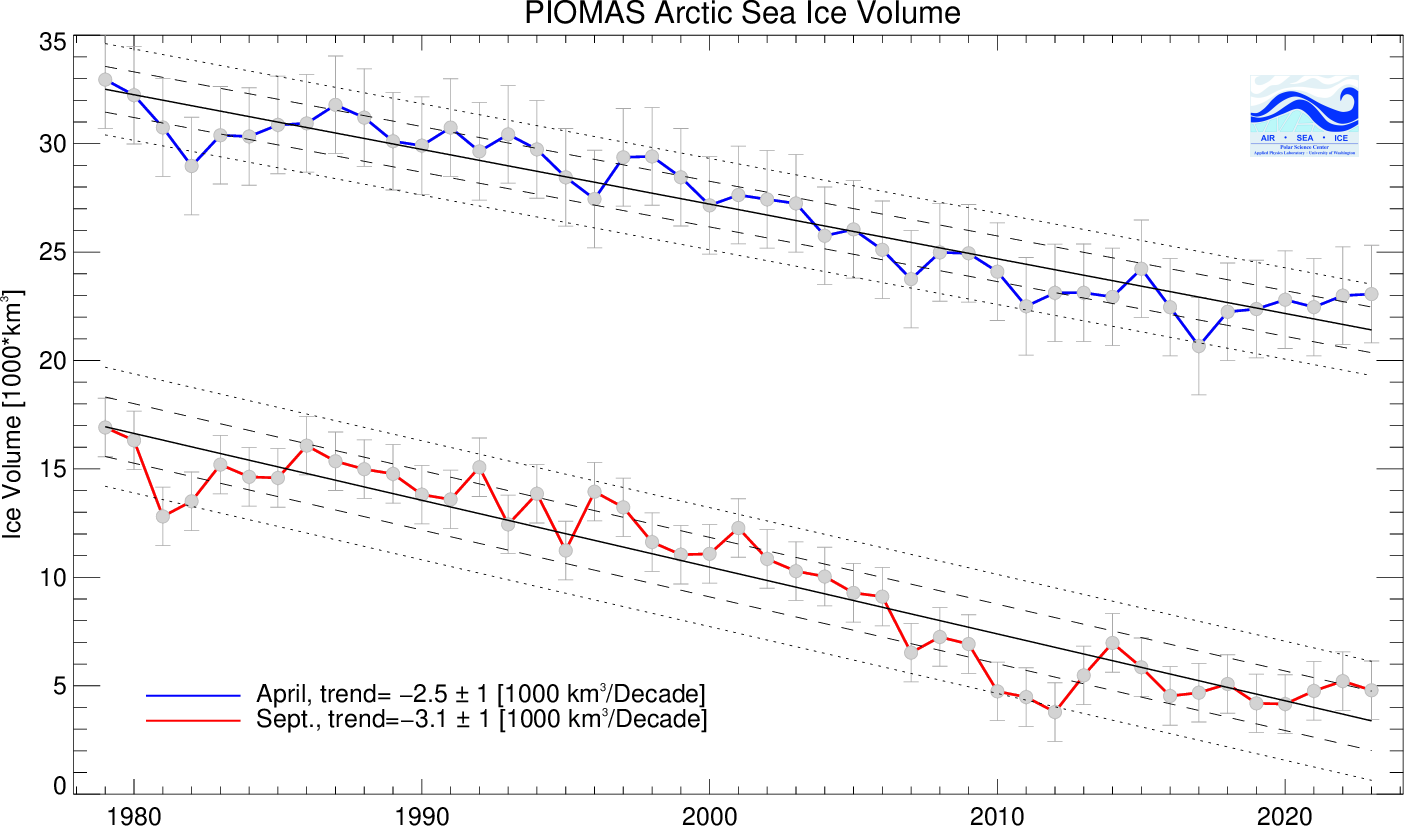
This data trend goes to zero in September of 2032. The 2 sigma span runs from 2023 to 2041. Do you think these data indicate ice is growing? By the way, the lower 2 sigma on the April trend indicate we could have a year round, ice-free Arctic before the end of the 21st century.
Last edited:


 Ryan Maue