Merry Christmas! North Pole Forecast To Be 50 Degrees Warmer Than Normal This Week

Lakhota

Diamond Member
Jul 14, 2011
158,382
73,369
2,330
Native America
585afe8b1800002c00e43ff0.jpeg


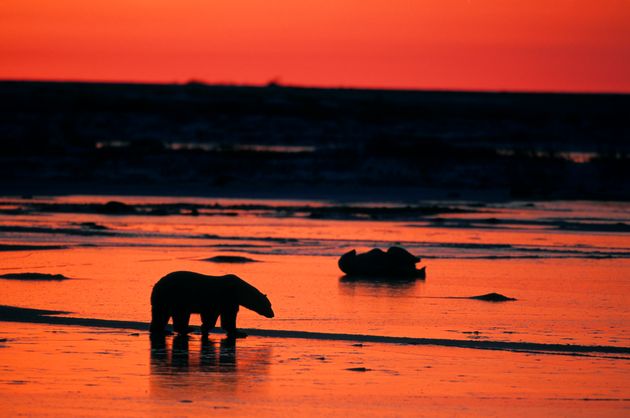
For the second year in a row, the Arctic is way hotter than it’s supposed to be.

Temperatures in the Arctic are predicted to soar nearly 50 degrees above normal on Thursday in a pre-Christmas heat wave that will bring the frozen tundra scarily close to the melting point.

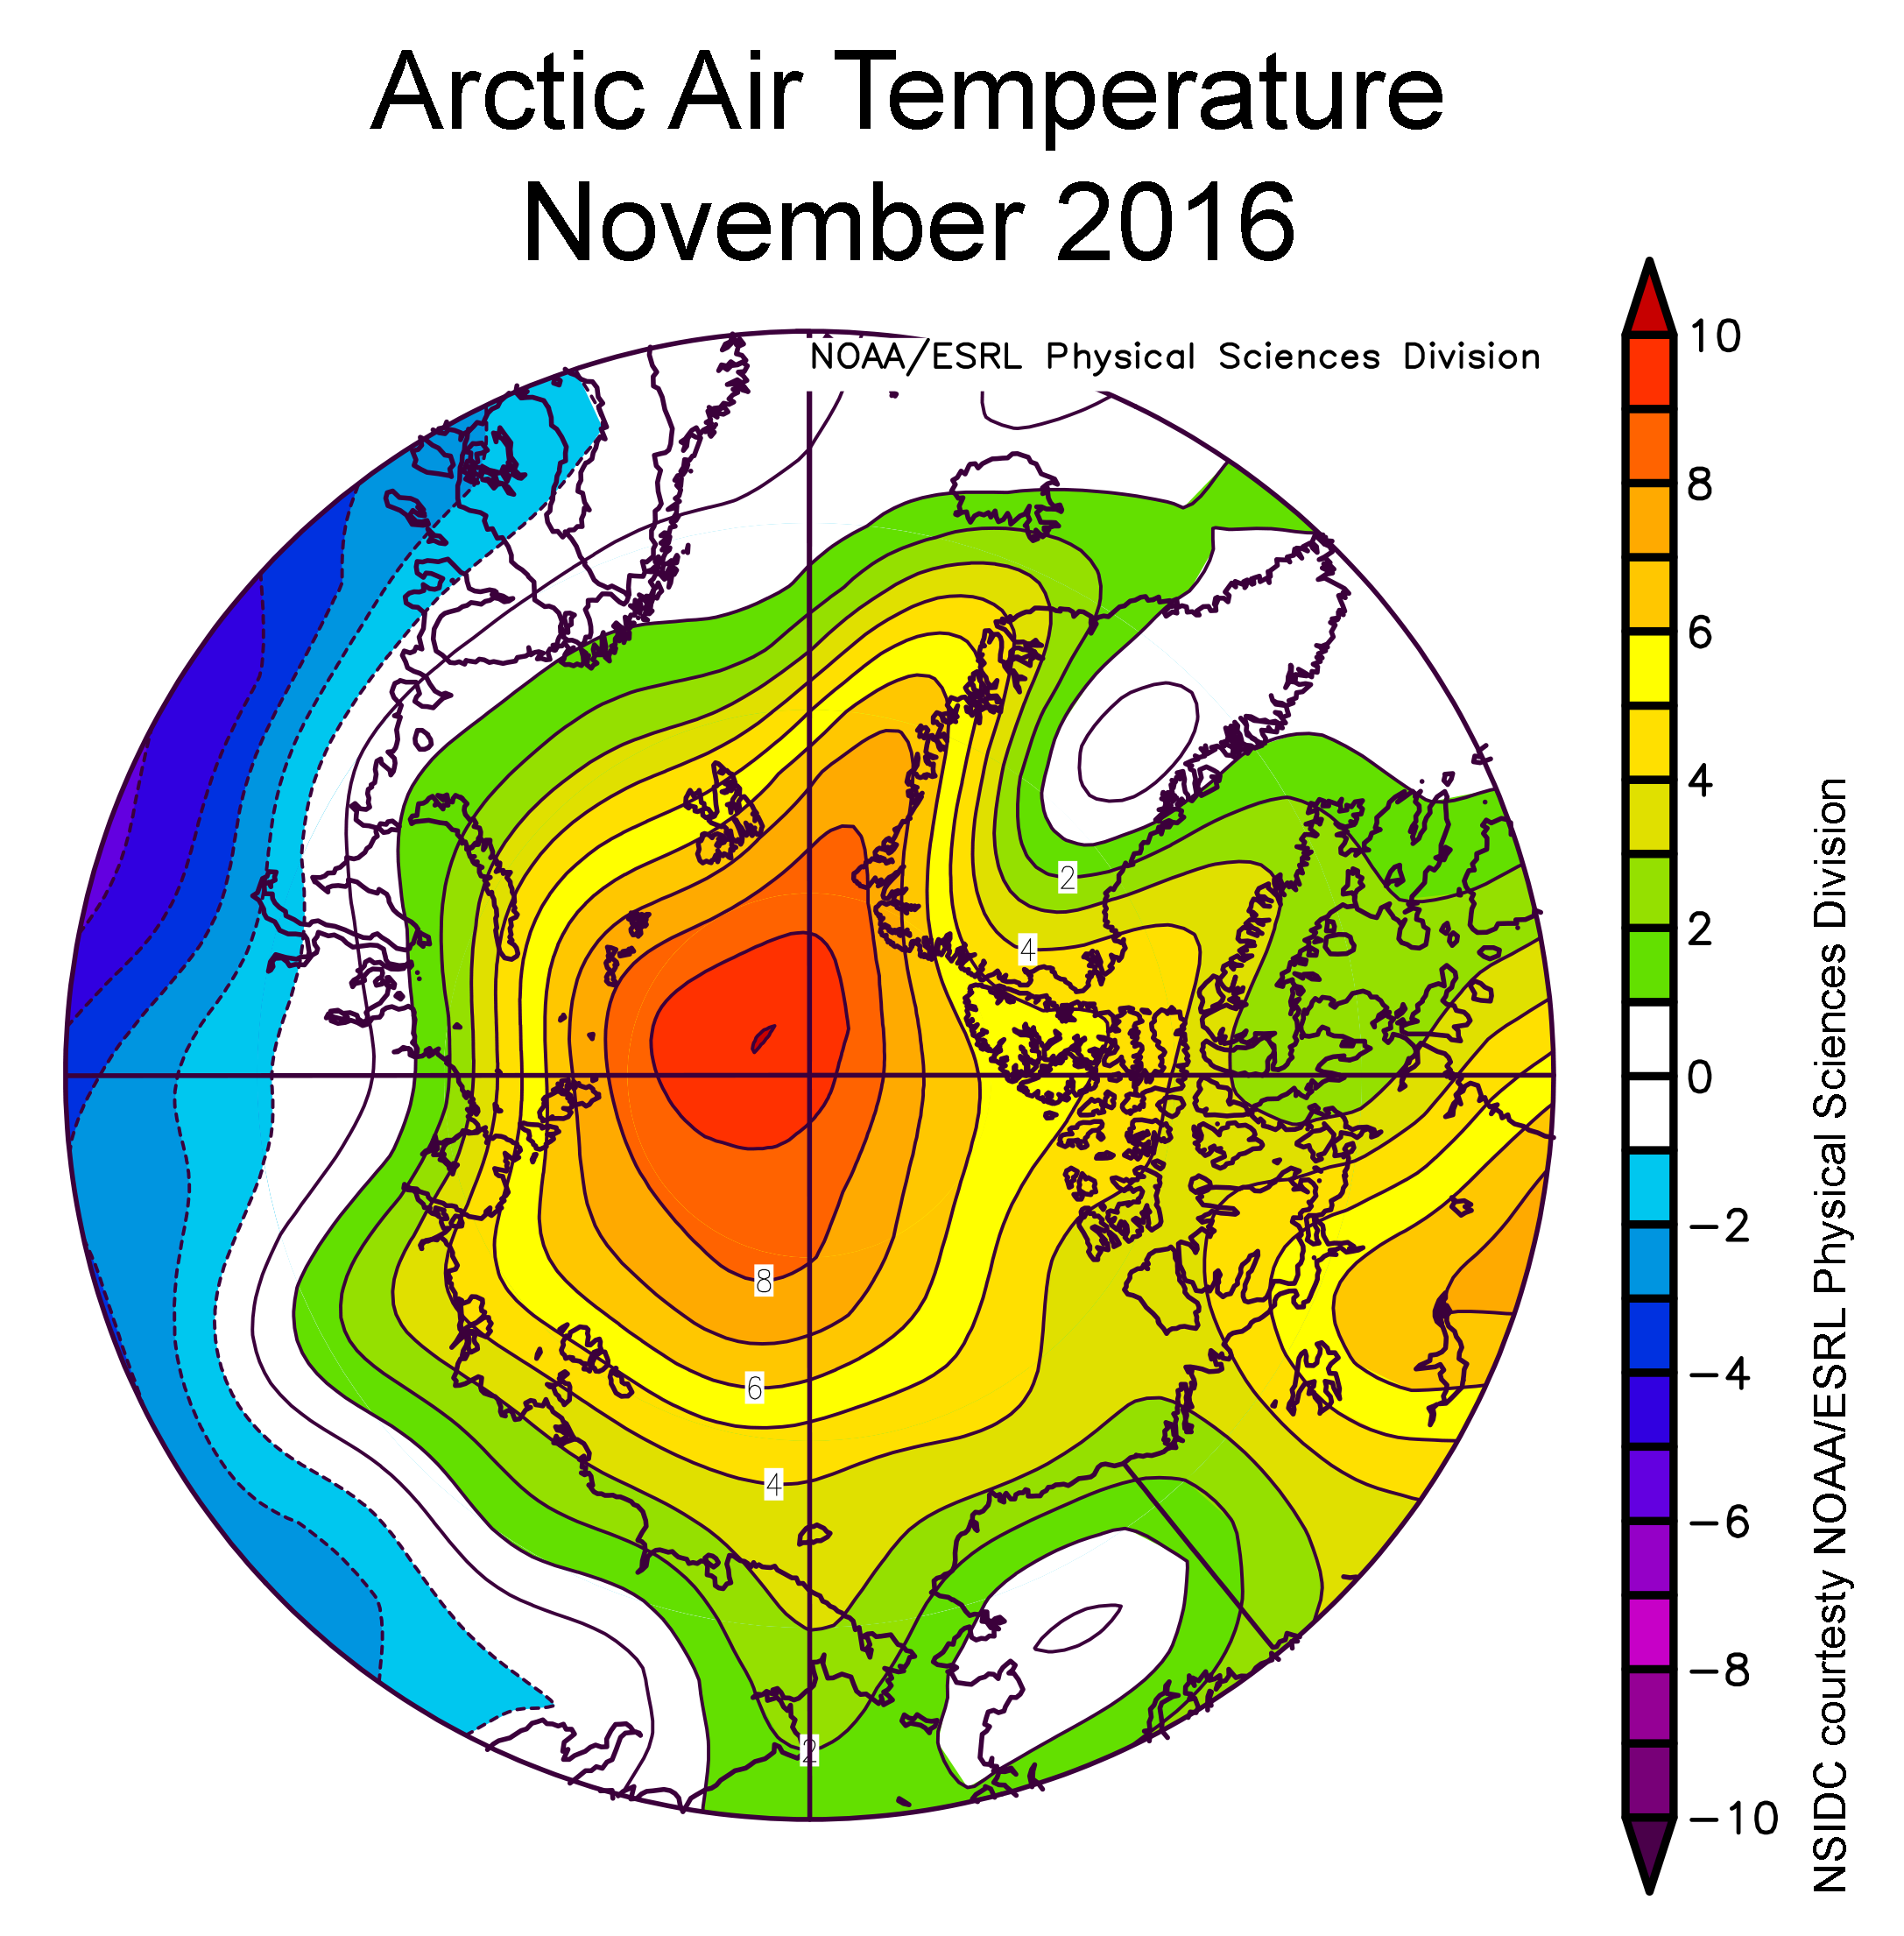
It’s the second year in a row the North Pole ― now in perpetual darkness after saying goodbye to the sun in late October ― has seen abnormally high temperatures around the Christmas holiday. It’s also the second time this year. In November, temperatures in the region skyrocketed 36 degrees above normal.

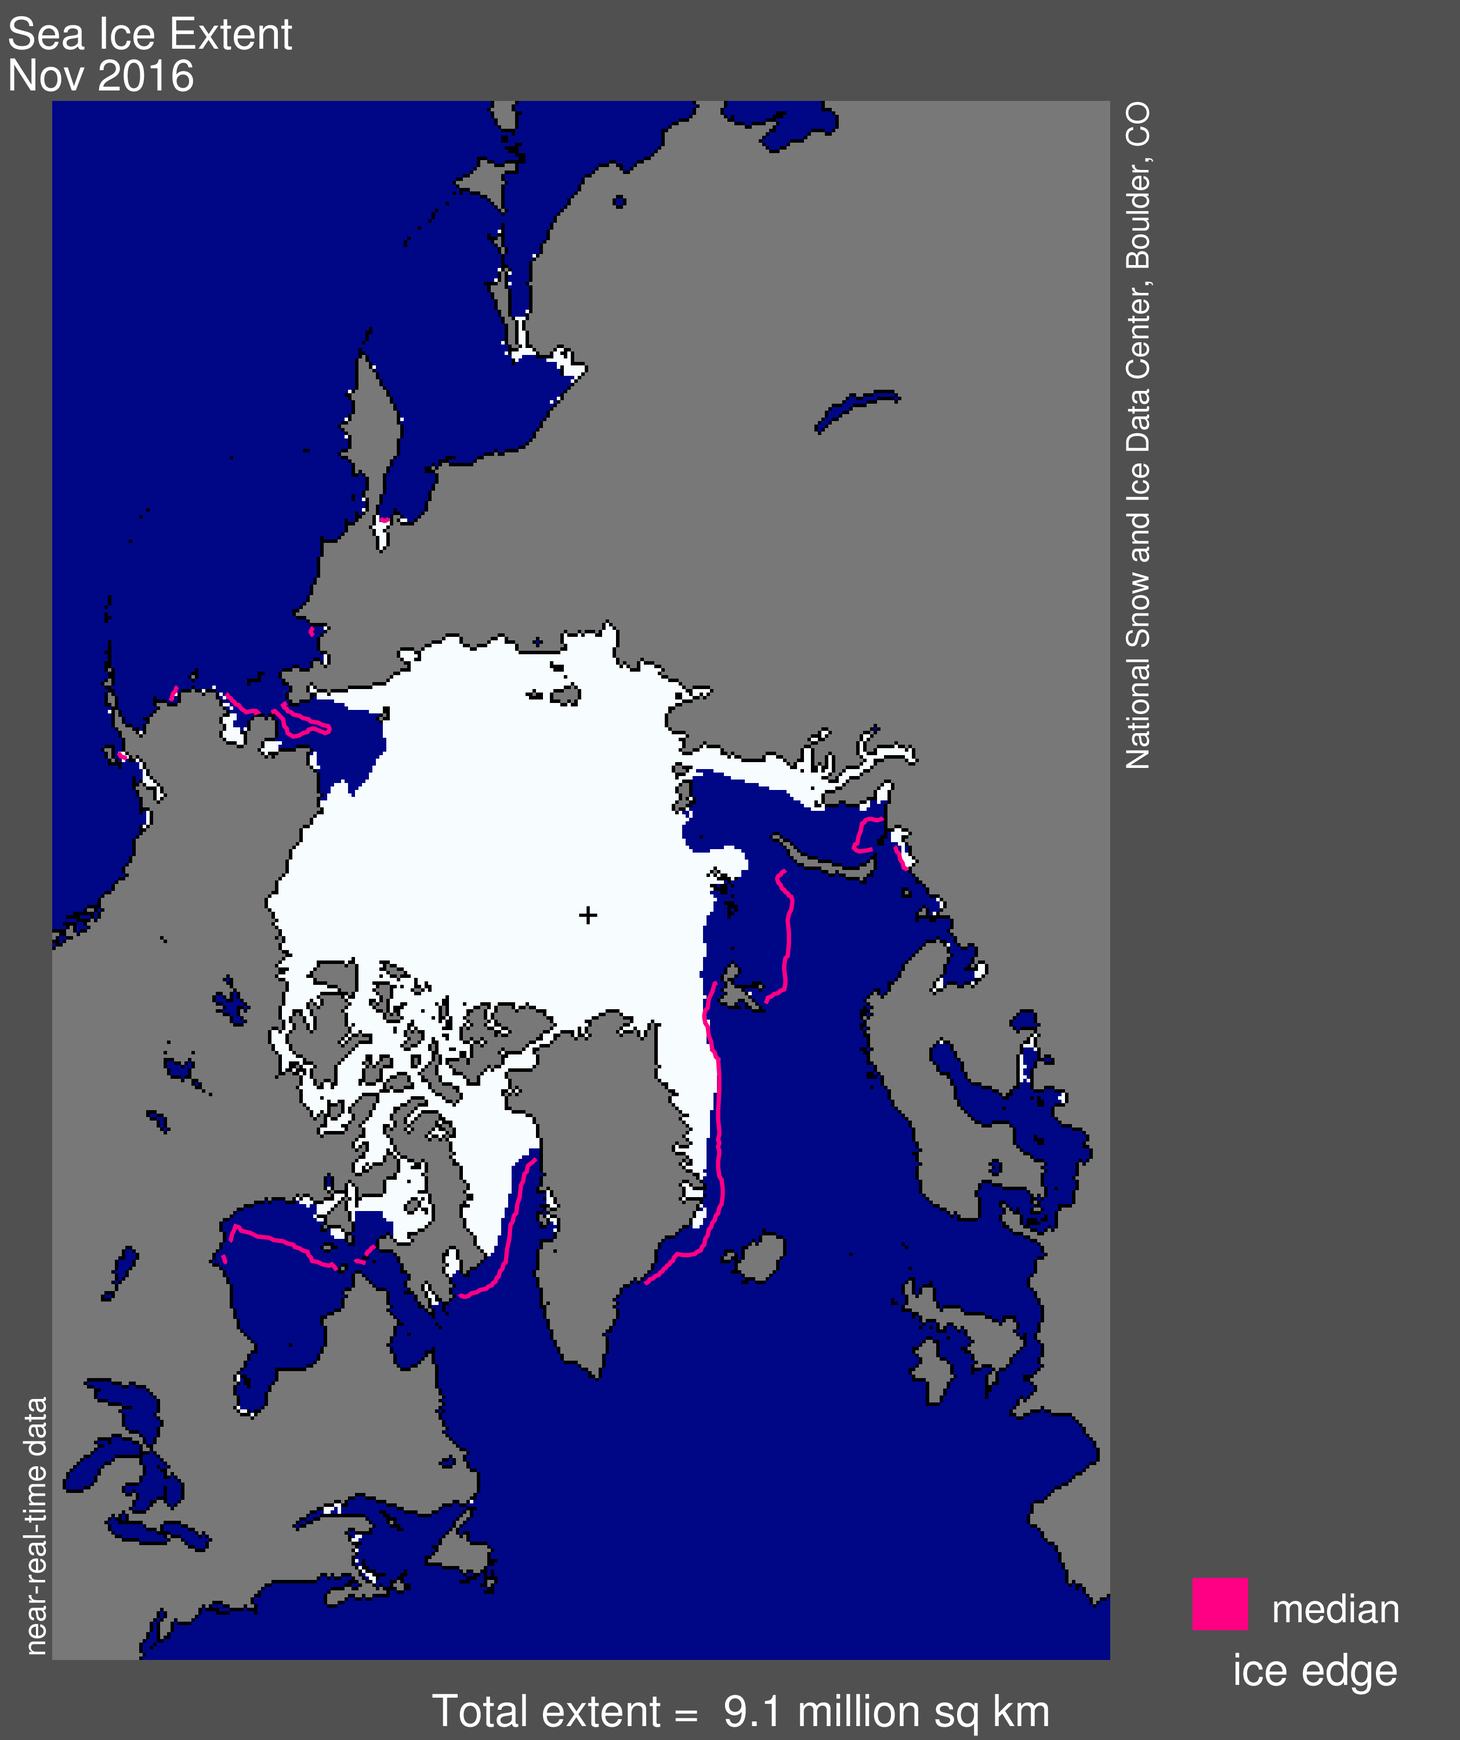
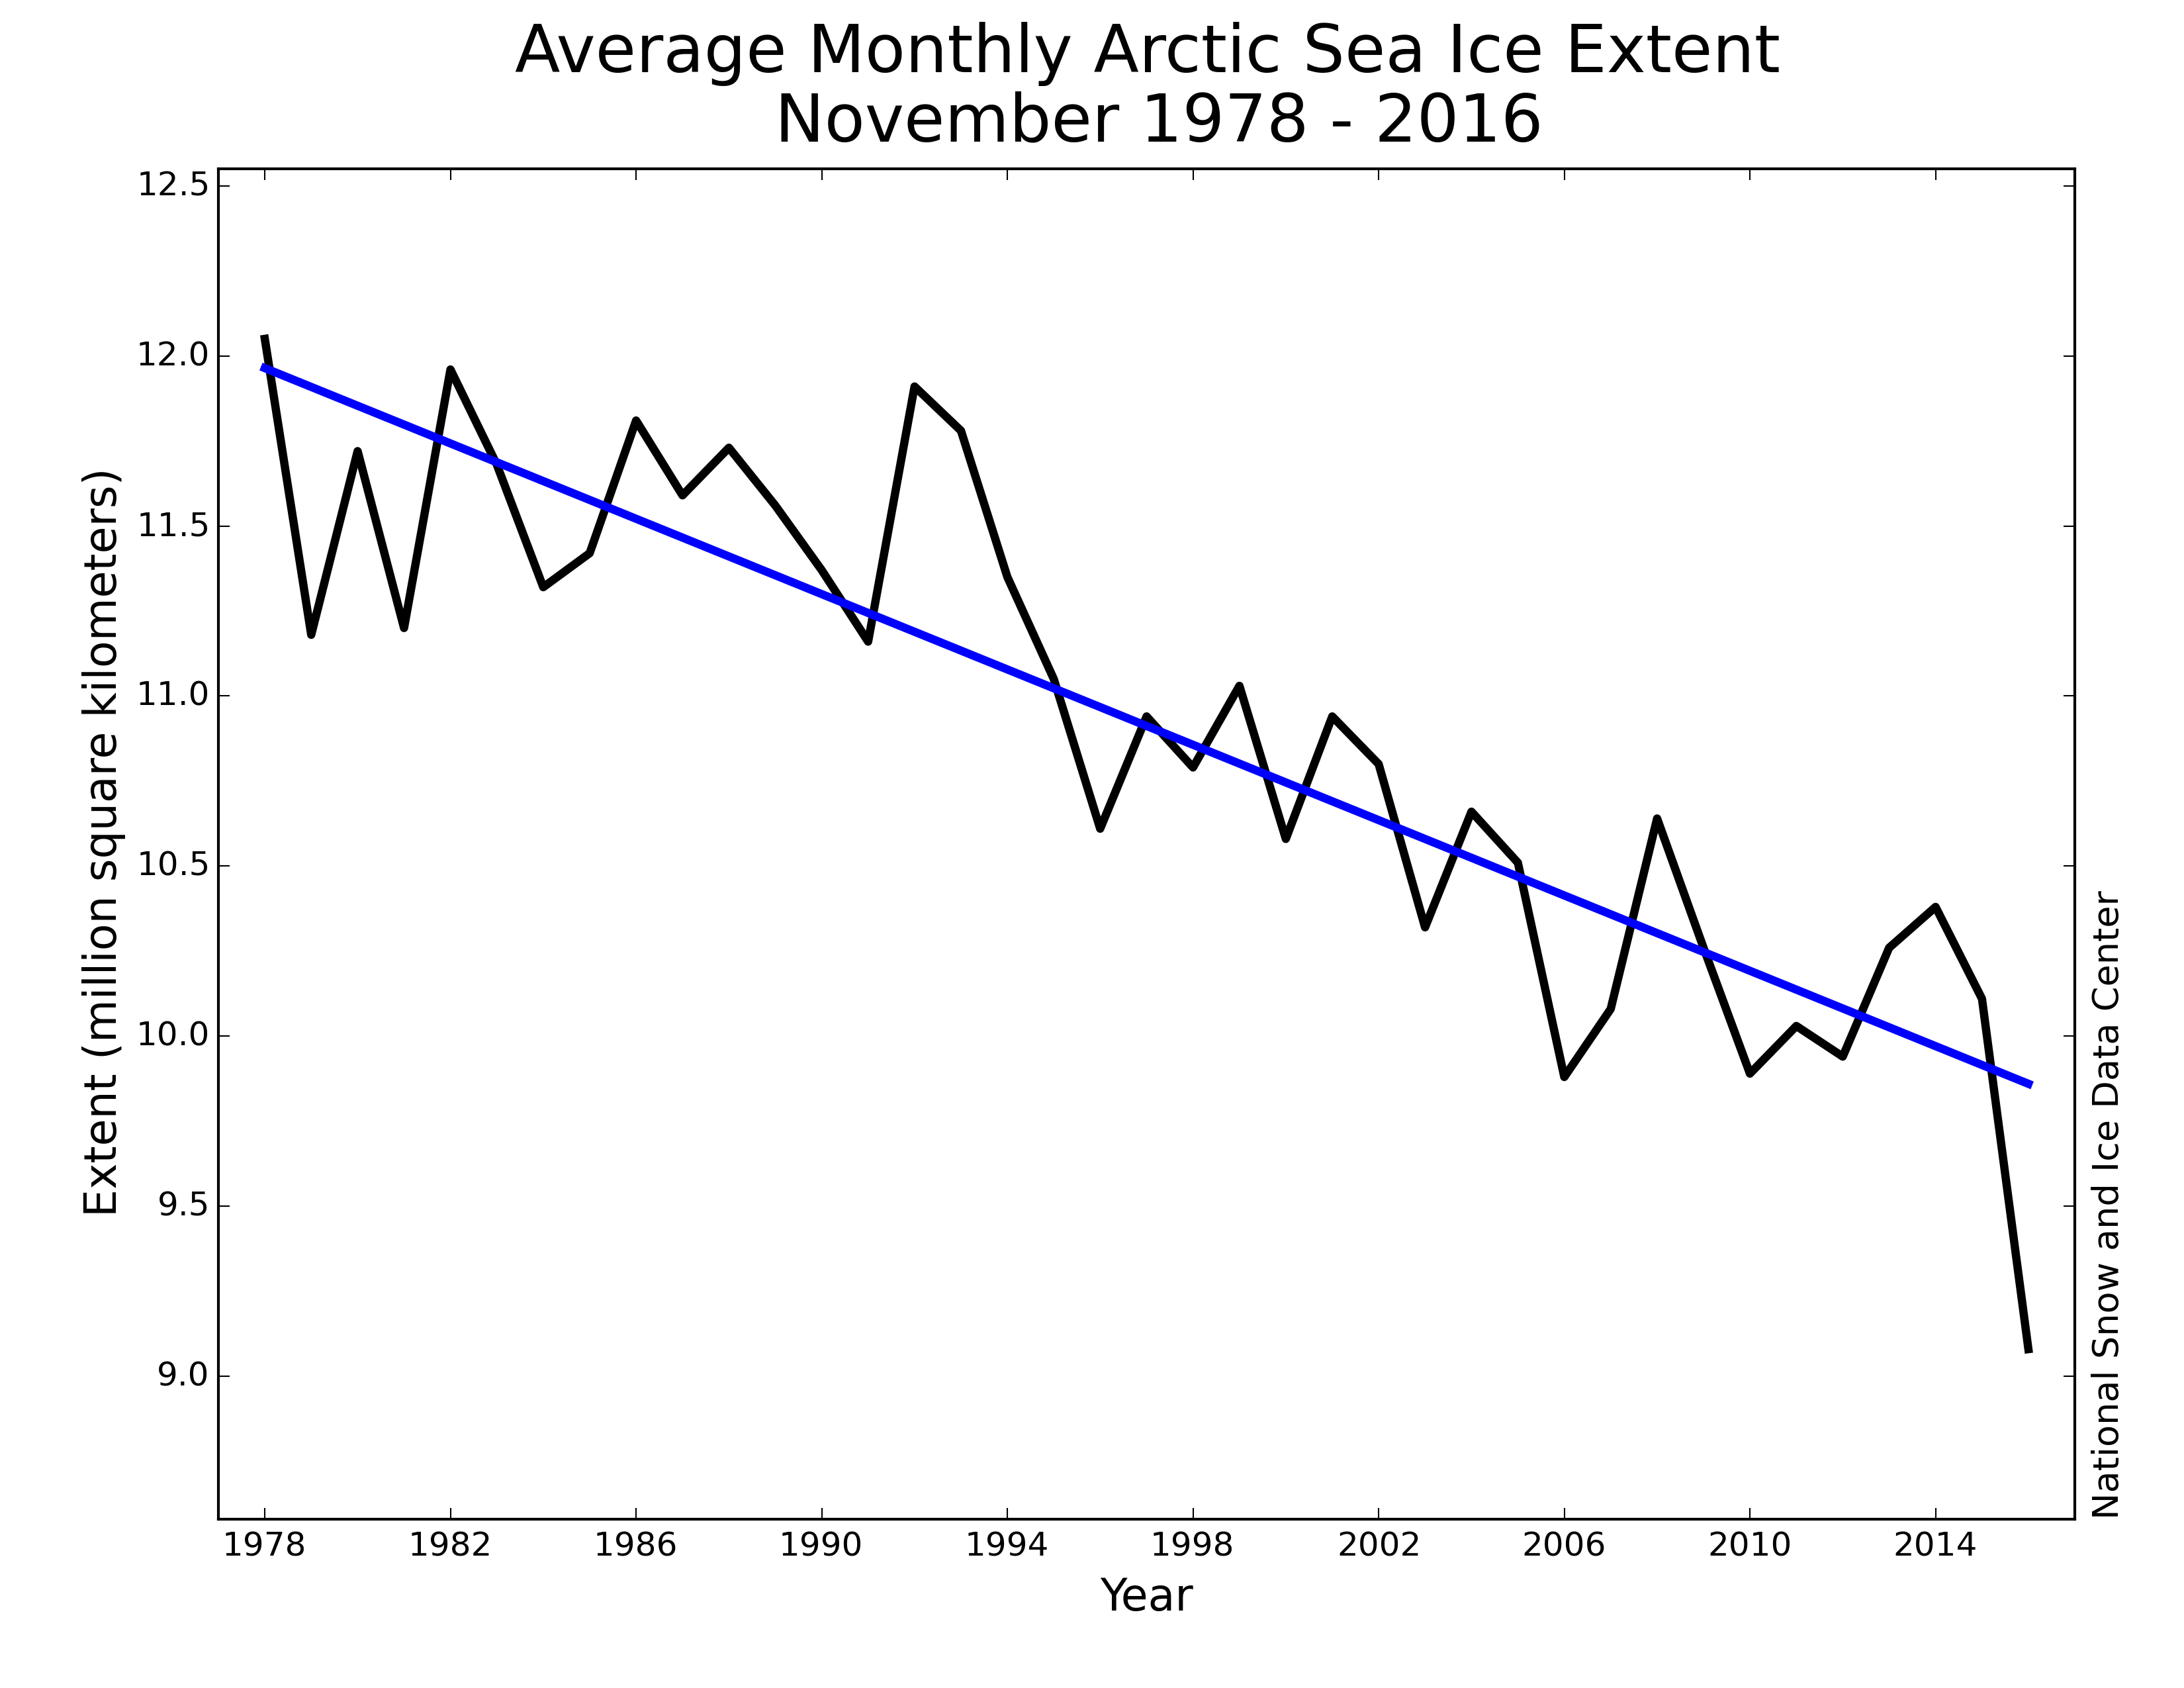
The weather forecast adds to a string of climate change-related indicators setting off serious warning bells in 2016. Polar sea ice is at record lows, and during last month’s heat wave, the region lost 19,000 square miles of it in just five days. The National Snow and Ice Data Center called the melt an “almost unprecedented occurrence.”

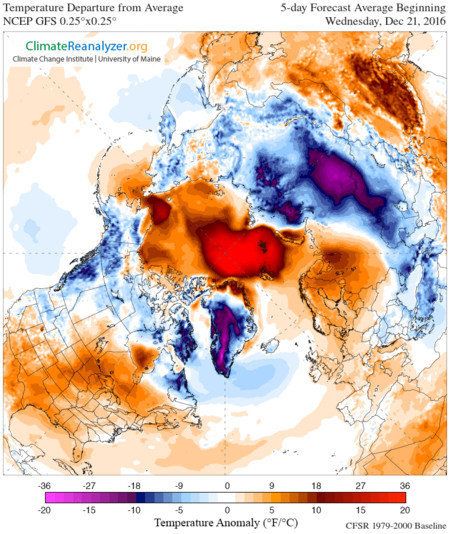
A graphic representation of this week’s predicted departure from average shows a giant red blob hovering over the pole. But red doesn’t accurately describe the forecast, which is so far above normal that it’s off the chart.

585afeea1c000011070ecea7.jpeg


The current heat wave has been caused by a few different factors, including what The Washington Post calls a “powerhouse storm east of Greenland” that’s pulling warm air up to the Arctic. The lack of sea ice, which usually acts as a temperature buffer, also has allowed warm air northward.

An analysis of the warming trends over the past several months conducted by scientists associated with the outlet Climate Central noted the low sea ice levels and unprecedented heat waves would be “extremely unlikely ... in the absence of human-induced climate change.”

The group of researchers warned that these anomalies could very well become the norm without urgent action to halt climate change and the release of planet-warming greenhouse gases.

“If nothing is done to slow climate change, by the time global warming reaches 2 ºC (3.6 ºF), events like this winter would become common at the North Pole, happening every few years,” the scientists wrote.

More: North Pole Forecast To Be 50 Degrees Warmer Than Normal This Week

Merry Christmas and a Happy New Year to all.
 
Holy shit. This is fucking scary.
Its a whole boat load of crap..

color_anomaly_NPS_ophi0.png

The arctic is currently below average temp... Several of the satellites are having major issues with instrumentation, affecting temperature readings.. The ones that are working do not show breathless Mathews dire fantasies..
 
Maybe the methane will explode upwards and warm the planet 3c in the next 10 years.

Then conservatives will see global warming.

I guess you were not around this summer when several scientists did empirical reviews on the north slope and found less than 5% of the methane others were making dire predictions about...
 
LOL...

Two Words....

BULL SHIT!

Here are four more words: TOO DUMB TO COMPREHEND.

Here are couple for you..

Ignorant retard that has no ability to use cognitive thought or critical reasoning... While believing all the crap shoved in front of him.. It took me all of thirty seconds to find out if the temperature was really vasolating and high like breathless Mathew purported.
 
Sweaty Santa? Freakishly warm weather forecast for North Pole


Santa's elves may be a bit warm this week during final Christmas preparations.

Temperatures at the North Pole are forecast to soar into the 20s Thursday. That might not sound balmy, but it's roughly 50 degrees above average at what's typically an unimaginably cold, pitch-black point in mid-winter.

In fact, the average winter temperature at the North Pole is about 40 degrees below zero, the Woods Hole Oceanographic Institution said.

This is the second straight December of freakish warmth spreading across the Arctic due to weird weather patterns shoving unusually warm air over the region. The cause this time around is a powerhouse storm east of Greenland, said Capital Weather Gang meteorologist Jason Samenow.

Counter-clockwise flow around the storm "is doing a wonderful job of (bringing) warm, moist maritime air over the Arctic sea ice and North Pole," WeatherBell meteorologist Ryan Maue said.

"It's clear that this warming event will be 'close enough' to freezing to be considered an extreme event like previous such warmings," Maue added.

The warmth should last for the next few days, before the "Siberian Express" takes over, bringing back typical cold over the region, he said.

A lack of sea ice appears to be playing a role: Record low levels of sea ice in the Arctic are contributing to the record high temperatures, noted Mashable's Andrew Freedman.

As usual, Silly Billy, a lying silly little twit didn't even check as to what is happening at the Pole. LOL
 
Holy shit. This is fucking scary.
Its a whole boat load of crap..

color_anomaly_NPS_ophi0.png

The arctic is currently below average temp... Several of the satellites are having major issues with instrumentation, affecting temperature readings.. The ones that are working do not show breathless Mathews dire fantasies..
Good lord, there are just a few tiny regions in the Arctic below normal, and a huge area north of Norway way above normal. Silly Bill simply cannot read a graph or a map. Tell us again about your degree in atmospheric physics. LOL
 
LOL....presented by the religion, as usual, as some kind of a anomoly precedent..........

More fakery from the climate k00ks...........its happened many times since the mid-20th century. And meanwhile, Siberia has been a stone cold frozen block of ice for the last 6 weeks with mega-snowfall.......another things the fakers don't want you to know.:eusa_dance::eusa_dance::gay:


"A study published in the journal Nature on Dec. 15 said these events have happened once or twice a decade going to back to the 1950s"

"When these excessive warm anomalies occur in the Arctic, the cold air which is usually present must go somewhere. In November, it piled up in Siberia and that is poised to happen again:"

Pre-Christmas melt? North Pole forecast to warm 50 degrees above normal Thursday


If you are sharp, you will always notice that the members of the religion never ever tell you the whole story...........because it would fuck their narrative. The level of ghey is profound.


I exist on t his forum to highlight the fakery:bye1::bye1:


fakery is ghey :gay:

 
Last edited:
Holy shit. This is fucking scary.
Its a whole boat load of crap..

color_anomaly_NPS_ophi0.png

The arctic is currently below average temp... Several of the satellites are having major issues with instrumentation, affecting temperature readings.. The ones that are working do not show breathless Mathews dire fantasies..

How about a link to these satellite problems you keep telling us about?
 
From NSIDC.org. Not a word about satellite issues. And, since both temperatures and ice extents are changing, the problem would have to be simultaneous and synchronous in multiple satellites.

Sea ice hits record lows

December 6, 2016


Average Arctic sea ice extent for November set a record low, reflecting unusually high air temperatures, winds from the south, and a warm ocean. Since October, Arctic ice extent has been more than two standard deviations lower than the long-term average. Antarctic sea ice extent quickly declined in November, also setting a record low for the month and tracking more than two standard deviations below average during the entire month. For the globe as a whole, sea ice cover was exceptionally low.

Overview of conditions

Figure 1. Arctic sea ice extent for November 2016 was 9.08 million square kilometers (3.51 million square miles). The magenta line shows the 1981 to 2010 median extent for the month. The black cross indicates the geographic North Pole. Sea Ice Index data. About the data

Credit: National Snow and Ice Data Center
High-resolution image

In November 2016, Arctic sea ice extent averaged 9.08 million square kilometers (3.51 million square miles), the lowest November in the satellite record. This is 800,000 square kilometers (309,000 square miles) below November 2006, the previous lowest November, and 1.95 million square kilometers (753,000 square miles) below the 1981 to 2010 long-term average for November. For the month, ice extent was 3.2 standard deviations below the long-term average, a larger departure than observed in September 2012 when the Arctic summer minimum extent hit a record low.

At this time of year, air temperatures near the surface of the Arctic Ocean are generally well below freezing, but this year has seen exceptional warmth. The overall rate of ice growth this November was 88,000 square kilometers (34,000 square miles) per day, a bit faster than the long-term average of 69,600 square kilometers (26,900 square miles) per day. However, for a brief period in the middle the month, total extent actually decreased by 50,000 square kilometers, or 19,300 square miles—an almost unprecedented occurrence for November over the period of satellite observations. A less pronounced and brief retreat of 14,000 square kilometers (5,400 square miles) occurred in 2013.

Ice growth during November as a whole occurred primarily within the Beaufort, Chukchi and East Siberian Seas, as well as within Baffin Bay. Ice extent slightly retreated in the Barents Sea for the month. Compared to the previous record low for the month set in 2006, sea ice was less extensive in the Kara, Barents, East Greenland, and Chukchi Seas, and more extensive in Baffin Bay this year.

Conditions in context

Figure 2a. The graph above shows daily Arctic sea ice extent as of December 5, 2016, along with daily ice extent data for four previous years. 2016 is shown in blue, 2015 in green, 2014 in orange, 2013 in brown, and 2012 in purple. The 1981 to 2010 average is in dark gray. The gray area around the average line shows the two standard deviation range of the data. Sea Ice Index data.

Credit: National Snow and Ice Data Center
High-resolution image


Figure 2b. This plot shows air temperature difference from average in the Arctic for November 2016. Air temperatures at the 925 hPa (approximately 2,500 feet) level in the atmosphere were above the 1981 to 2010 average over the entire Arctic Ocean and, locally up to 10 degrees Celsius (18 degrees Fahrenheit) above average near the North Pole. This is in sharp contrast to northern Eurasia, where temperatures were up to 4 to 8 degrees Celsius (7 to 14 degrees Fahrenheit) below average.

Credit: NSIDC courtesy NOAA/ESRL Physical Sciences Division
High-resolution image

Continuing the warm Arctic pattern seen in October, November air temperatures were far above average over the Arctic Ocean and Canada. Air temperatures at the 925 hPa level (about 2,500 feet above sea level) were above the 1981 to 2010 average over the entire Arctic Ocean and, locally up to 10 degrees Celsius (18 degrees Fahrenheit) above average near the North Pole. This is in sharp contrast to northern Eurasia, where temperatures were as much as 4 to 8 degrees Celsius (7 to 14 degrees Fahrenheit) below average (Figure 2b). Record snow events were reported in Sweden and across Siberia early in the month.

In autumn and winter, the typical cyclone path is from Iceland, across the Norwegian Sea and into the Barents Sea. This November, an unusual jet stream pattern set up, and storms instead tended to enter the Arctic Ocean through Fram Strait (between Svalbard and Greenland). This set up a pattern of southerly wind in Fram Strait, the Eurasian Arctic and the Barents Sea and accounts for some of the unusual warmth over the Arctic Ocean. The wind pattern also helped push the ice northwards and helps to explain why sea ice in the Barents Sea retreated during November.

Sea surface temperatures in the Barents and Kara Seas remained unusually high, which also helped prevent ice formation. These high sea surface temperatures are a result of warm Atlantic water circulating onto the Arctic continental shelf seas.

November 2016 compared to previous years

Figure 3. Monthly November ice extent for 1979 to 2016 shows a decline of 5.0 percent per decade.

Credit: National Snow and Ice Data Center
High-resolution image

Through 2016, the linear rate of decline for November is 55,400 square kilometers (21,400 square miles) per year, or 5.0 percent per decade.
 
color_anomaly_NPS_ophi0.png

The arctic is currently below average temp... Several of the satellites are having major issues with instrumentation, affecting temperature readings.. The ones that are working do not show breathless Mathews dire fantasies..

Your graphic doesn't show "below average temp". It shows it right at average and the surrounding waters above. And if several satellites are having problems, where is the announcement and from where did these obviously satellite-derived data come?
 
I find this graphic, which shows actual temperatures (not anomalies), to be near the freezing (aka the melting) point. Hardly a normal situation in Arctic mid winter.

SSTabsolute%20Arctic.gif
 
Last edited:
like I said.............more fakery ^^......as if Greenland and Siberia didn't exist!:2up:. Again.....this has happened many, many times and the cold shifts ( as it has to ). Never see the religion talking about that though.

Always a pleasure to point out natural fluctuations to non-OCD board members.:coffee:
 

Forum List

Back
Top