Lists

Putting on the tinfoil cap, Ian? It's all a grand conspiracy. All these scientists worldwide just don't know science. LOL

what did I say that made you jump to conspiracy theories? do they poll their members before making policy statements? do those policy statements explicitly state that catastophe is going to happen? or do they say IF the warming trend continues, IF the rise in CO2 leads to amplification of the known small effect of CO2 to the large effect projected by climate models, THEN climatic disturbances could be either be deletorious or beneficial to mankind. anything else wouldnt be very scientific would it?

not that I expect any semblance of scientific thought from you. you think weather is proof of global warming. you seem to be able to hold two or more mutually exclusive ideas in your head at the same time while ferverently believing all of them to be true.

Actually the one scientific society of which I am a member does indeed poll it's members on subjects like this.


how big of a majority does it take to pass? does it publicly state what the results of the vote were?
 
My, my. So what we have here is an arguement concerning the statistical interpretation of the data. And by the authors interpretation the warming is less than that of the interpretations of Stieg and Mann. Less, but still warming.

In other words, you are now reduced to stating 'Oh, well it's really not that bad'. I suppose someone will make a third study with differant statistical methods that show that Stieg and Mann underestimated the warming.


Skeptic paper on Antarctica accepted – rebuts Steig et al | Watts Up With That?

Abstract

A detailed analysis is presented of a recently published Antarctic temperature reconstruction that combines satellite and ground information using a regularized expectation-maximization algorithm. Though the general reconstruction concept has merit, it is susceptible to spurious results for both temperature trends and patterns. The deficiencies include: (a) improper calibration of satellite data; (b) improper determination of spatial structure during infilling; and (c) suboptimal determination of regularization parameters, particularly with respect to satellite principal component retention. We propose two methods to resolve these issues. One utilizes temporal relationships between the satellite and ground data; the other combines ground data with only the spatial component of the satellite data. Both improved methods yield similar results that disagree with the previous method in several aspects. Rather than finding warming concentrated in West Antarctica, we find warming over the period of 1957-2006 to be concentrated in the Peninsula (≈0.35oC decade-1). We also show average trends for the continent, East Antarctica, and West Antarctica that are half or less than that found using the unimproved method. Notably, though we find warming in West Antarctica to be smaller in magnitude, we find that statistically significant warming extends at least as far as Marie Byrd Land. We also find differences in the seasonal patterns of temperature change, with winter and fall showing the largest differences and spring and summer showing negligible differences outside of the Peninsula.

Region RLS C/Dec E-W C/Dec S09 C/Dec
Continent 0.06 ± 0.08 0.04 ± 0.06 0.12 ± 0.09
East Antarctica 0.03 ± 0.09 0.02 ± 0.07 0.10 ± 0.10
West Antarctica 0.10 ± 0.09 0.06 ± 0.07 0.20 ± 0.09
Peninsula 0.35 ± 0.11 0.32 ± 0.09 0.13 ± 0.05

Copyright © 2010 American Meteorological Association

(early online release to be available on or around Dec. 7th)


Old Rocks has learned the methods of the hockey team well. the original intent of the O'donnell paper was to show that Stieg 09 used incorrect methodology that smeared the warming on the antarctic penninsula over the rest of antarctica. and they did that in spades, showing bad methods, bad data, corrupted splices, and gibberish results. no one said that the peninsula wasnt warming, it is because of ocean currents. it is the rest of the continent that is cooling overall, which throws a kibosh on climate models that predict there must be warming at the poles.

here is a pictorial view of how screwed up Stieg 09 is. if you add a warming trend in one area it magically pops up somewhere else. - Bishop Hill blog - Steig's method massacred
 
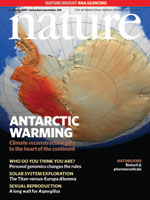
do you think Nature will put the rebuttal on its cover? no, I dont either.

Nature.jpg


whats that quote? a lie is halfway around the world before the truth can get its pants on. not unlike the Hockey Stick graph, this bogus paper on antarctica will live forever even if it is total BS. the AGW alarmists know it, and use peer review to make sure it will continue to happen.
 
LOL. In need of the tinfoil hat there again, Ian.

hahaha, tinfoil hat? your guys keep getting caught out in using bogus methods and data to support there failing case and you say I am the one wearing a tinfoil hat? hahaha

you are the one who is struggling to avoid having to admit that you were duped by charlatans.
 
Ian, I get most of my data from the USGS, and other geological organizations, organizations like the Wood Hole Institute. Non-political, and scientific with definite areas of interest. Now if there were serious problems with the science of AGW, some scientific organization from some nation would be pointing those problems out.

You see, that is what the OP was all about. Where are the scientific organizaitions stating the AGW is a hoax?


I know and understand what you are trying to say Old Rocks. Do you try to understand what I am trying to say?

There is a huge difference between saying 'increased CO2 will cause some warming and that may be dangerous down the road' and 'AGW alarmism is a hoax'.

You may be right. Personally I dont think so because the earth would have tipped long ago if it was so fragile. Also, everytime I look into a story, article or paper there is another one that contradicts it. So many of the bigwigs of AGW alarmism have been shown to have exaggerated their claims that I dont trust them. Your side has idiots like Gore, my side has buffoons like Moncton. I dont like being lied to. The Little Ice Age and Medieval Warm Period are real, therefor the Hockey Stick is crap. Why did the climate science community stick up for Mann and his corrupt methods? Any gardener knows that the Urban Heat Island effect is real, why did the climate science community stick up for Jones and his bogus study? Why have the temperature data been so cavalierly changed over and over again, always supporting warming (exception being the recent RSS decline, still unexplained).

My problem is that politics seems to really matter in climate science. We used to laugh at the USSR for their intrusion into science but now we have become them
 
My, my. So what we have here is an arguement concerning the statistical interpretation of the data. And by the authors interpretation the warming is less than that of the interpretations of Stieg and Mann. Less, but still warming.

In other words, you are now reduced to stating 'Oh, well it's really not that bad'. I suppose someone will make a third study with differant statistical methods that show that Stieg and Mann underestimated the warming.


Skeptic paper on Antarctica accepted – rebuts Steig et al | Watts Up With That?

Abstract

A detailed analysis is presented of a recently published Antarctic temperature reconstruction that combines satellite and ground information using a regularized expectation-maximization algorithm. Though the general reconstruction concept has merit, it is susceptible to spurious results for both temperature trends and patterns. The deficiencies include: (a) improper calibration of satellite data; (b) improper determination of spatial structure during infilling; and (c) suboptimal determination of regularization parameters, particularly with respect to satellite principal component retention. We propose two methods to resolve these issues. One utilizes temporal relationships between the satellite and ground data; the other combines ground data with only the spatial component of the satellite data. Both improved methods yield similar results that disagree with the previous method in several aspects. Rather than finding warming concentrated in West Antarctica, we find warming over the period of 1957-2006 to be concentrated in the Peninsula (≈0.35oC decade-1). We also show average trends for the continent, East Antarctica, and West Antarctica that are half or less than that found using the unimproved method. Notably, though we find warming in West Antarctica to be smaller in magnitude, we find that statistically significant warming extends at least as far as Marie Byrd Land. We also find differences in the seasonal patterns of temperature change, with winter and fall showing the largest differences and spring and summer showing negligible differences outside of the Peninsula.

Region RLS C/Dec E-W C/Dec S09 C/Dec
Continent 0.06 ± 0.08 0.04 ± 0.06 0.12 ± 0.09
East Antarctica 0.03 ± 0.09 0.02 ± 0.07 0.10 ± 0.10
West Antarctica 0.10 ± 0.09 0.06 ± 0.07 0.20 ± 0.09
Peninsula 0.35 ± 0.11 0.32 ± 0.09 0.13 ± 0.05

Copyright © 2010 American Meteorological Association

(early online release to be available on or around Dec. 7th)


Try looking at the maps moron. Only the Antarctic peninsula is warming, central Antarctica is cooling. Nice to see you're as adept at map reading aas you are at basic reasoning. Can you find the US on a globe?
 
And that is all you have, isn't it? Innuendo concerning the honesty of the scientists. Indictutive of your own honesty.


Oh we have far more than that olfraud. Far more. I post to the WUWT page because he has the best abbreviated review of the soon to be published rebuttal of Steig et al that purported to show extensive Antarctic wide warming. The new paper shows quite powerfully that Steig et al got it COMPLETELY wrong and were guilty of using incorrect methodology to support their cause (Mann was a co writer-go figure).

That the rebuttal will be published in the Journal of Climate is a minor miracle considering that Steig was one of the reviewers of the paper (unethical in the extreme, but once again par for the course) and the writers were forced to work on their paper for 10 months before the editor finally allowed it through (and interestingly enough that was accomplished by ADDING a 4th reviewer), the upshot is simply this, the "warming" that Steig et al claimed was occuring isn't.

Skeptic paper on Antarctica accepted – rebuts Steig et al | Watts Up With That?


there is so much to that whole scandal. it actually started 2 years ago when a researcher found errors in the data Stieg and the hockey team used for the antarctica paper. he emailed Stieg and posted a comment at Climate Audit. Amazingly enough Gavin Schmidt found the same error himself only hours after being informed of it. the Hockey team at Real Climate must be getting really pissed off that amateurs prove them wrong on a regular basis.


I would say every time so far.
 
LOL. In need of the tinfoil hat there again, Ian.


If Ian is wearing the tin hat, you and your fellow incompetents, invented them.:lol:

It doesn't require a tin hat to figure out that your bestest and brightest can't do basic science. Congrats, your PhD's are among the most incompetent ever created....must make you proud.
 
Hey Walleyes, if all these scientists are so wrong, why is the January, 2011 extent of the Arctic Ice the lowest ever recorded for that time of year? Why are 90% or better of the alpine glaciers in the world in rapid retreat?

You claim to be a scientist, but never miss an oppertunity to diss scientists.


Gee, I don't know. Can we trust anything your boys report? So far they can't do statistics nor can they do complex math. So far they are batting zero. And for the record I honor GOOD SCIENTISTS!

Bad scientists on the other hand are deserving of nothing but SCORN.
 
My boys? Virtually all the scientists in the AGU, the GSA, the Royal Society, and all the other scientific societies dealing with this problem.

How does it feel being scorned?
 
Meanwhile, away from the Flat Earth EnviroMarxist hysteria, the number of repeatable scientific experiment showing a 200PPM increase raises temperature is still 0.
 
My boys? Virtually all the scientists in the AGU, the GSA, the Royal Society, and all the other scientific societies dealing with this problem.

How does it feel being scorned?


That statement on its face is ridiculous. The AGW movement is promulgated by a fairly small subset of activist scientists. As has been pointed out to you many times before, the various scientific organisations rarely poll their membership, the leadership of the groups decides what their POV is going to be.

To be scorned by the likes of these twits I quite like actually. I don't make sophomoric mistakes on a constant basis like these imbeciles. And please answer IanCs question..

"Old Rocks- I really would like to know if you approve of Mann and Jones misuse of methods and data. they are supposedly top of their field, so do you think their obviously sophomoric mistakes were done on purpose to exaggerate their results or do you think they really are so bad at their occupation that they honestly made the mistakes? or is there some other excuse that you think is more reasonable?"
 
Parrots and idiots like "OldRocks" have many things in common, they can only parrot but not read themselves:
Where do North Atlantic icebergs come from? — Infoplease.com
The principal origin of those icebergs that reach the North Atlantic Ocean are the 100 or so major tidewater glaciers of West Greenland. Between 10,000 to 15,000 icebergs are calved each year, primarily from 20 major glaciers between the Jacobshaven and Humboldt Glaciers.
nasa-greenland-glacier.jpg

It has long since been proven that glaciers are not MELTING! They are pushed by force of gravity downhill and when they reach the sea, they are broken up by tidal action. How complicated could it be to understand that?
Jo the Plumber would have no problem with that! "OldRocks" would connect a solid pipe to a diesel engine sitting in hard rubber mounts, while any "non scientific" mechanic would use a flex pipe.

Forscherskandal: Heißer Krieg ums Klima - SPIEGEL ONLINE - Nachrichten - Wissenschaft

Forscher haben Appelle von Umweltverbänden "etwas verstärkt"
Die Zusammenarbeit mit der Umweltlobby wurde für viele seiner Kollegen zur Selbstverständlichkeit. Dem WWF etwa schickten australische und britische Klimaforscher auf Nachfrage besonders pessimistische Prognosedaten. Sie zeigten dabei ausdrücklich Verständnis dafür, dass der Umweltverein die Warnungen etwas "verstärkt" haben wollte, wie es der WWF im Juli 1999 in einer E-Mail forderte. Ein australischer Klimatologe bezeichnete es in einer E-Mail vom 28. Juli 1999 gegenüber Kollegen als "sehr beunruhigend", sollten sich in einer Umweltschutzbroschüre Daten fänden, die nahelegten, der Klimawandel könne in "weiten Teilen der Welt einen zu vernachlässigenden Effekt haben".

I know he wont take the trouble to paste this text into an online translation service, so here are the highlights AGAIN

Climate research sacandal
Climate Researches had "amplified" their findings for the WWF conference. And suppressed data had been leaked that climate change has a largely negligible effect world wide

This rodent re-appears like a rat as soon as the rat catchers are gone...now he is here!
 
Last edited:
http://news.sky.com/skynews/Home/Wo...t-An-Accelerated-Rate/Article/201007415674119

Dr Alun Hubbard, leading a team from the universities of Swansea and Aberystwyth said the ice sheet in their region had lowered six metres in just a month.

The phenomenon is caused by surface melt, a vicious cycle in which melted ice brings about further thawing of the cap beneath it.

As the ice turns to liquid, its surface reflectivity decreases, absorbing more of the heat from the sun, and accelerating the melt.

Frozen ice has an "albedo", or reflectivity, of around 80%, whereas open water reflects only around 20% of the sun's rays.

Sky News flew in with the team to their base on the inland ice, near to the town of Kangerlussuaq.
 
Greenland ice sheet losing mass on northwest coast

ScienceDaily (Mar. 24, 2010) — Ice loss from the Greenland ice sheet, which has been increasing during the past decade over its southern region, is now moving up its northwest coast, according to a new international study.

Led by the Denmark Technical Institute's National Space Institute in Copenhagen and involving the University of Colorado at Boulder, the study indicated the ice-loss acceleration began moving up the northwest coast of Greenland starting in late 2005. The team drew their conclusions by comparing data from NASA's Gravity and Recovery Climate Experiment satellite system, or GRACE, with continuous GPS measurements made from long-term sites on bedrock on the edges of the ice sheet.
 

Forum List

Back
Top