Lists

The following groups say the danger of human-caused climate change is a … FRAUD:

American Petroleum Institute
US Chamber of Commerce
National Association of Manufacturers
Competitive Enterprise Institute
Industrial Minerals Association
National Cattlemen’s Beef Association
Great Northern Project Development
Rosebud Mining
Massey Energy
Alpha Natural Resources
Southeastern Legal Foundation
Georgia Agribusiness Council
Georgia Motor Trucking Association
Corn Refiners Association
National Association of Home Builders
National Oilseed Processors Association
National Petrochemical and Refiners Association
Western States Petroleum Association
The Republican Party of America

Climate Change – Have a look at the following lists. Which side are you on?


You omitted NASA. There is no measurable climate change of Earth's biome at this time nor has there been for roughly 470 years. There will be, in about 100 years, and this is normal for planets such as ours.

Good post.

Robert
 
No, the EPA will not be defunded, no more than the Health Care Bill was repealed. The Conservatives will just continue to make fools of themselves. You are an excellant example of that.

You must be collecting brownie points so You will be first in line for the Greenhouse Gas Police.
173-0812052327-Green-Police--24457.jpg


All this crap is a classic case of wagging the dog:


fake-NewYorkPost.JPG


Based on Hollywood "science":
submerged-New-York-AI-2001.jpg


So now, explain this, if we are living now on a "Greenhouse Gas Planet" where the temperatures have been allegedly climbing for 10 Years how do You explain the "Brown house" effect that lasted for over a decade:...Are You going to claim that a "El Niño" or a "La Niña" did that and lasted THAT LONG?

The worst day of the “Dirty Thirties” – TRUE DAKOTAN

The Dust Bowl of the 1930’s was a devastating period of weather extremes and artificially eroded soils resulting in terrible dust storms coupled with alternating drought and heat with blizzards and floods.
Temps soared past 1000 during July-1936
High temperatures and very little rain made conditions in Central South Dakota unbearable in the summer of 1936 — a year after “Black Sunday” and the huge dust storm.

According to the July 25, 1974 Mitchell Daily Republic, the average July-1936 daily temperature was 103.4 degrees. The Mitchell area had 27 consecutive days of temperatures exceeding 90 degrees and 18 straight days with the mercury climbing past 100 degrees.
It turns out the area was having troubles once again in 1974 when highs ranged between 92 degrees and 106 degrees for 18 straight days (Juoly 6-23)

But 1974 was at once incorporated into the "hockey stick" temperature trend.
While the "dirty thirties" lasted till 1940 and ranged deep into Canada as well
fig16_4.jpg


0610_dust_bowl_1.jpg

image002.jpg

Weather -
The Dust Bowl or the Dirty Thirties was a period of severe dust storms causing major ecological and agricultural damage to American and Canadian prairie lands from 1930 to 1936 (in some areas until 1940). The phenomenon was caused by severe drought A series of dust storms displaced

The dog wagging experts know, that if You fucked a dog once before, he`ll bite Your hand off if You try and grab his tail again.
So they wait for the old dog to die and do it later with the stupid puppies!
But now the problem is, that the not so stupid new generation puppies can share the entire dog fucker list over the internet


Robert_Stephens
You omitted NASA. There is no measurable climate change of Earth's biome at this time nor has there been for roughly 470 years. There will be, in about 100 years, and this is normal for planets such as ours.

http://www.infoplease.com/ipa/A0113527.html
Alabama –27 –33 Jan. 30, 1966 New Market 760
Alaska –80 –62 Jan. 23, 1971 Prospect Creek Camp 1,100
Arizona –40 –40 Jan. 7, 1971 Hawley Lake 8,180
Arkansas –29 –34 Feb. 13, 1905 Pond 1,250
California –45 –43 Jan. 20, 1937 Boca 5,532
Colorado –61 –52 Feb. 1, 1985 Maybell 5,920
Connecticut –32 –36 Jan. 22, 19611 Coventry 480
Delaware –17 –27 Jan. 17, 1893 Millsboro 20
D.C. –15 –26 Feb. 11, 1899 Washington 410
Florida –2 –19 Feb. 13, 1899 Tallahassee 193
Georgia –17 –27 Jan. 27, 1940 CCC Camp F-16 est. 1,000
Hawaii 12 –11 May 17, 1979 Mauna Kea 13,770
Idaho –60 –51 Jan. 18, 1943 Island Park Dam 6,285
Illinois –36 –38 Jan. 5, 1999 Congerville 635
Indiana –36 –38 Jan. 19, 1994 New Whiteland 785
Iowa –47 –44 Feb. 3, 19961 Elkader 770
Kansas –40 –40 Feb. 13, 1905 Lebanon 1,812
Kentucky –37 –38 Jan. 19, 1994 Shelbyville 730
Louisiana –16 –27 Feb. 13, 1899 Minden 194
Maine –48 –44 Jan. 19, 1925 Van Buren 510
Maryland –40 –40 Jan. 13, 1912 Oakland 2,461
Massachusetts –35 –37 Jan. 12, 1981 Chester 640
Michigan –51 –46 Feb. 9, 1934 Vanderbilt 785
Minnesota –60 –51 Feb. 2, 1996 Tower 1,460
Mississippi –19 –28 Jan. 30, 1966 Corinth 420
Missouri –40 –40 Feb. 13, 1905 Warsaw 700
Montana –70 –57 Jan. 20, 1954 Rogers Pass 5,470
Nebraska –47 –44 Dec. 22, 19891 Oshkosh 3,379
Nevada –50 –46 Jan. 8, 1937 San Jacinto 5,200
New Hampshire –47 –44 Jan. 29, 1934 Mt. Washington 6,262
New Jersey –34 –37 Jan. 5, 1904 River Vale 70
New Mexico –50 –46 Feb. 1, 1951 Gavilan 7,350
New York –52 –47 Feb. 18, 19791 Old Forge 1,720
North Carolina –34 –37 Jan. 21, 1985 Mt. Mitchell 6,525
North Dakota –60 –51 Feb. 15, 1936 Parshall 1,929
Ohio –39 –39 Feb. 10, 1899 Milligan 800
Oklahoma –27 –33 Jan. 18, 19301 Watts 958
Oregon –54 –48 Feb. 10, 19331 Seneca 4,700
Pennsylvania –42 –41 Jan. 5, 1904 Smethport est. 1,500
Rhode Island –25 –32 Feb. 5, 1996 Greene 425
South Carolina –19 –28 Jan. 21, 1985 Caesars Head 3,115
South Dakota –58 –50 Feb. 17, 1936 McIntosh 2,277
Tennessee –32 –36 Dec. 30, 1917 Mountain City 2,471
Texas –23 –31 Feb. 8, 19331 Seminole 3,275
Utah –69 –56 Feb. 1, 1985 Peter's Sink 8,092
Vermont –50 –46 Dec. 30, 1933 Bloomfield 915
Virginia –30 –34 Jan. 22, 1985 Mountain Lake 3,870
Washington –48 –44 Dec. 30, 1968 Mazama & Winthrop 2,120; 1,765
West Virginia –37 –38 Dec. 30, 1917 Lewisburg 2,200
Wisconsin –55 –48 Feb. 4, 1996 Couderay 1,300
Wyoming –66 –54 Feb. 9, 1933 Riverside R.S. 6,500

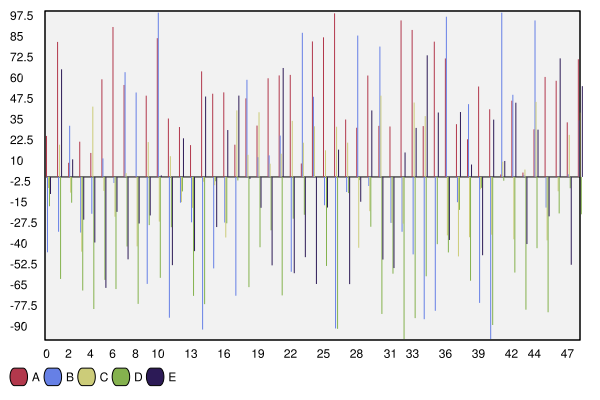
There is no trend

too-many-bars-vecto.png


These Bastards have already been confronted even by the British Parliament of having cherry picked only from the top part of a purely random set of data...

208422main_global_temp_change.jpg


They just could not (yet!!!) be convicted of DELIBERATE FRAUD...because they are not talking
I already posted that
Either You are utterly stupid or You think You can just move into the next town (or forum thread...as it were) and keep going on organ grinding and snake oil selling
 
Last edited:
Hmmm...... The OP was about who states what concerning global warming, not about the financial dealing of either side. Now if you can point out a scientific society that states that AGW is a fraud, why are don't you do that? All the yap-yap about Al Gore and cap and trade is just red herring attempts to divert attention from the fact that virtually the whole of the scientific community states that AGW is real, and a clear and present danger.


s0n.....you are so hopelessly naive...........

This idiot thinks that the "green economy" is about the good intentions of industry in providing technology to stop:lol: global warming from happening. That speical interests dont exist on the side of the "real" scientists.........and that the skeptics side is all about big oil and special interests.


And THATS why we call them k00ks, my friends!!!:funnyface:

PHOTO-21345-5041166P-34.jpg


Well son......they are able to navigate in society by finding rather asocial niches where the fringe mentality wont be a crutch to being able to assimilate on some level!!.
 
Last edited:
Kooky, quit dodging, point out a scientific society that supports your point of view. Just one, mind you, even from Outer Slobovia.
 
Kooky, quit dodging, point out a scientific society that supports your point of view. Just one, mind you, even from Outer Slobovia.


Ummm..........ahhhh..........the whole point is, moron, that the special interests leads the science. Not the other way around...............


Monday, March 8, 2010
The Climate Industry Wall of Money
Source: joannenova.com.au

When it comes to spending in the climate change debate, Big Oil’s supposed evil influence has been vastly outdone by Big Government, and even those taxpayer billions are trumped by Big-Banking.

Follow the money
Money for Skeptics: Greenpeace has searched for funding for man-made global warming skeptics and found $23 million dollars paid by Exxon over ten years (which has stopped).

But in the end, everyone spends more on carbon friendly initiatives than on skeptics—even Exxon: (how about $100 million for Stanford’s Global Climate and Energy Project and $600 million for Biofuels research).

Money for the Climate Industry: The US government spent $79 billion on climate research and technology since 1989—to be sure, this funding paid for things like satellites and studies, but it’s 3,500 times as much as anything offered to skeptics. It buys a bandwagon of support, a repetitive rain of press releases, and includes PR departments of institutions like NOAA, NASA, the Climate Change Science Program and the Climate Change Technology Program. The $79 billion figure does not include money from other western governments, private industry, and is not adjusted for inflation. In other words, it could be…a lot bigger.

There is no question that there are vastly more financial rewards for people who promote a carbon-made catastrophe than for those who point out the flaws in the theory.

Ultimately the big problem is that there are no grants for scientists to demonstrate that carbon has little effect. There are no Institutes of Natural Climate Change, but plenty that are devoted to UnNatural Forces.

Continue reading »

Abel Danger: Climate Change


facts suck s0n.........huh??!!!!!!!!!!!: Only goofballs think carts come before horses!!


DOMINANCE
 
Last edited:

Since there is nobody listed in this Forum by that user name I`ll try and explain it to Rock & Cement heads yet again. Can You read?


Fig5e.jpg

Fig. 5: Replication of the result presented in Fig. 4 (From Adler and El�as (2000). Length of solar Cycle SCL (filled circles), maximum ionospheric electron density in respective 11-year sunspot cycle (plus signs), Northern Hemisphere temperature anomalies (empty triangles), and local temperature anomalies in San Miguel de Tucuman, Argentina (empty circles ) show a significant covariation. As explained in the text, the downward movement at the end of the SCL curve does not indicate that there is no longer any effect of solar activity on climate.


image002.jpg


Would this happen now say from 2011 to 2021 there is no doubt what the high priests of "climate science" would say:

See Pharaoh did not listen to Moses and now the sky darkened


And again here is how "climatology" cherry picked their data:

159_7.png


This graph has no line representing solar activity, but its right up top in this post here!

Does somebody have to draw You a line for solar activity in pretty color into this graph for You, because Your little brain is over taxed if I don`t do it for You??


homer_doh.gif


Can`t wrap You head around it can You?
 
Kooky, quit dodging, point out a scientific society that supports your point of view. Just one, mind you, even from Outer Slobovia.

The problem with Rock and Cement heads is, that they don`t read source information themselves, but keep quoting what "experts" who pre-digest it as baby food Pablem for their following.

Had You read the source data Yourself You would have clearly seen who has been doing the picking out to support a point of view


SPIEGEL ONLINE has analyzed the more than 1,000 Climategate e-mails spanning a period of 15 years, e-mails that are freely available over the Internet and which, when printed out, fill five thick files.

Here it is in English this time:


How Climate Researchers Plotted with Interest Groups

Even before the UN climate conference in Kyoto in 1997, environmentalist groups and leading climate researchers began joining forces to put pressure on industry and politicians. In August 1997, Greenpeace sent a letter to The Times newspaper in London, appealing on behalf of British researchers. All the climatologists had to do was sign on the dotted line. In October of that year, other climate researchers -- ostensibly acting on behalf of the World Wildlife Fund, or WWF -- e-mailed hundreds of colleagues calling on them to sign an appeal to the politicians in connection with the Kyoto conference.

Researchers 'Beef Up' Appeals by Environmental Groups

Wigley's calls fell on deaf ears, and many of his colleagues unthinkingly fell in line with the environmental lobby. Asked to comment by WWF, climate researchers in Australia and Britain, for example, made particularly pessimistic predictions. What's more, the experts said they had been fully aware that the WWF wanted to have the warnings "beefed up," as it had stated in an e-mail dated July 1999. One Australian climatologist wrote to colleagues on July 28, 1999, that he would be "very concerned" if environmental protection literature contained data that might suggest "large areas of the world will have negligible climate change."

Hasselmann blamed the media for all the hype. In fact, sociologists have identified "one-up debates" in the media in which darker and darker pictures were painted of the possible consequences of global warming. "Many journalists don't want to hear about uncertainty in the research findings,"

Nonetheless, scientists have tried to apply pressure on the media if they disagreed with the way stories were reported. Editorial offices have been inundated with protest letters whenever news stories said that the dangers of runaway climate change appeared to be diminishing. E-mails show that climate researchers coordinated their protests, targeting specific journalists to vent their fury on. For instance, when an article entitled " What Happened to Global Warming?" appeared on the BBC website in October 2009, British scientists first discussed the matter among themselves by e-mail before demanding that an apparently balanced editor explain what was going on.

"Don't leave anything for the skeptics to cling on to," wrote renowned British climatologist Phil Jones of the University of East Anglia (UEA) in a leaked e-mail dated Oct. 4, 2000. Jones, who heads UEA's Climate Research Unit (CRU), is at the heart of the e-mail scandal. But there have always been plenty of studies that critics could quote because the research findings continue to be ambiguous.


'Effective Long-Term Strategies'

Paleoclimatologist Michael Mann from Pennsylvania State University also tried to rein in his colleagues. In an e-mail dated Sept. 17, 1998, he urged them to form a "united front" in order to be able to develop "effective long-term strategies." Paleoclimatologists try to reconstruct the climate of the past. Their primary source of data is found in old tree trunks whose annual rings give clues about the weather in years gone by.

No one knows better than the researchers themselves that tree data can be very unreliable, and an exchange of e-mails shows that they discussed the problems at length.

The only problem is that you get different climate change graphs depending on which data you use.


Mann and his colleagues were pioneers in this field. They were the first to draw up a graph of average temperatures in the Northern Hemisphere over the past 1,000 years. That is indisputably an impressive achievement. Because of its shape, his diagram was dubbed the "hockey stick graph." According to this, the climate changed little for about 850 years, then temperatures rose dramatically (the blade of the stick). However, a few years later, it turned out that the graph was not as accurate as first assumed.

In 1999, CRU chief Phil Jones and fellow British researcher Keith Briffa drew up a second climate graph. Perhaps not surprisingly, this led to a row between the two groups about which graph should be published in the summary for politicians at the front of the IPCC report.
The hockey stick graph was appealing on account of its convincing shape. After all, the unique temperature rise of the last 150 years appeared to provide clear proof of man's influence on our climate

But what appeared at first glance to be fraud was actually merely a face-saving fudge: Tree-ring data indicates no global warming since the mid-20th century, and therefore contradicts the temperature measurements. The clearly erroneous tree data was thus corrected by the so-called "trick" with the temperature graphs.


'I Think I'll Delete the File'

In 2003, mineralogist Stephen McIntyre and economist Ross McKitrick published a paper that highlighted systematic errors in the statistics underlying the hockey stick graph. However Michael Mann rejected the paper, which he saw as part of a "highly orchestrated, heavily funded corporate attack campaign," as he wrote in September 2009.

More and more, Mann and his colleagues refused to hand out their data to "the contrarians," as skeptical researchers were referred to in a number of e-mails. On Feb. 2, 2005, Jones went so far as to write, "I think I'll delete the file rather than send it to anyone."

Today, Mann defends himself by saying his university has looked into the e-mails and decided that he had not suppressed data at any time.

However, an inquiry conducted by the British parliament came to a very different conclusion. "The leaked e-mails appear to show a culture of non-disclosure at CRU and instances where information may have been deleted to avoid disclosure," the House of Commons' Science and Technology Committee announced in its findings on March 31.
head-in-the-sand.gif


I guess sticking Your head into the sand is less painful than having Your balloon deflated about our 21st Century moses
gore_big_mouth.jpg


Again, since no one by that user name exists here I shall explain it again.
This time let`s go into the Math and the Physics, which are way beyond You, Your Moses Al Gore and his flock of sheep;


solar.gif


Solar flux measured at 20h UTC on 2.8 GHz was 91.2 (increasing 11.0 over the last solar rotation). The planetary A index was 4 (STAR Ap - based on the mean of three hour interval ap indices: 3.6). Three hour interval K indices: 11000122 (planetary), 01011222 (Boulder).

of approximately 100,000 lux or lumens per square meter at the Earth's surface.

To calculate the amount of sunlight reaching the ground, both the elliptical orbit of the Earth and the attenuation by the Earth's atmosphere have to be taken into account. The extraterrestrial solar illuminance (Eext), corrected for the elliptical orbit by using the day number of the year (dn), is given by

4d183d38b0bbdae7bba5ab70c555b879.png


The solar constant includes all types of solar radiation, not just the visible light. It is measured by satellite to be roughly 1.366 kilowatts per square meter (kW/m²)

The total insolation remains almost constant due to Kepler's second law,

6075c64c5e5902bc6d2a2290199fe8a7.png


where A is the "areal velocity" invariant. That is, the integration over the orbital period (also invariant) is a constant.

4b06135b7b3c3ba59f7acd722668d847.png


But the seasonal and latitudinal distribution and intensity of solar radiation received at the Earth's surface also varies.[10] For example, at latitudes of 65 degrees the change in solar energy in summer & winter can vary by more than 25% as a result of the Earth's orbital variation.

The total solar energy absorbed by Earth's atmosphere, oceans and land masses is approximately 3,850,000 exajoules (EJ) per year. In 2002, this was more energy in one hour than the world used in one year.

The amount of solar energy reaching the surface of the planet is so vast that in one year it is about twice as much as will ever be obtained from all of the Earth's non-renewable resources of coal, oil, natural gas, and mined uranium combined.


Now lets see what Your Moses and his high priests of climatology had to say about 2002:


=http://data.giss.nasa.gov/gistemp/2002/]Data.GISS: GISTEMP — Global Temperature Trends, 2002

GISS Surface Temperature Analysis

Global Temperature Trends: 2002 Summation

The 2002 meteorological year is the second warmest year in the period of accurate instrumental data (since the late 1800s). The global surface temperature for 12 months from December 2001 through November 2002 is 0.51°C above the climatological mean (1951-1980 average) in the GISS analysis, which uses meteorological station measurements over land and satellite measurements of sea surface temperature over the ocean.
2002fig1_s.gif
2002fig3_s.gif


And it`s all because of our SUV`s.....they try and tell ME?


dodo%20flat%20earth%202.jpg


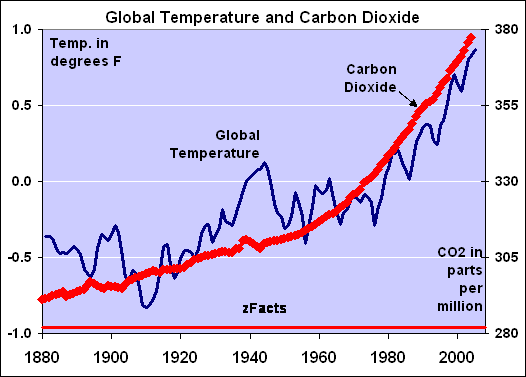
Evidence that CO2 is Cause
zFacts-CO2-Temp.gif


The slight downward trend in temperature from about 1945 until about 1975 is due to the increase in Sulfate Aerosols (SO4), largely produced by burning coal that contains sulfur. These cool the earth, and their increase during these years largely canceled the increase in CO2 during the same period.


Fuck You ALL I know MY Math!
And Skookerasbil, Mathew, IanC, Westerwall, etc etc and me are not willing to pay for Your fucking stupidity, that is YOUR PROBLEM all You Rock an Cement heads

Maybe try ripping off a few jungle tribes that cater to witch doctors,

traditional-zulu-witchdoctor-blackpeoplesoutafrica.jpg


They can read correlations between bone/stone patterns and what`s going to happen, just like any of your climatology correlation "scientists" can
You might get lucky with them!....But that`s a no can do either because there is no way to con them into "Greenhouse Gas" taxation either
 
Last edited:
The following groups say the danger of human-caused climate change is a … FRAUD:

American Petroleum Institute
US Chamber of Commerce
National Association of Manufacturers
Competitive Enterprise Institute
Industrial Minerals Association
National Cattlemen’s Beef Association
Great Northern Project Development
Rosebud Mining
Massey Energy
Alpha Natural Resources
Southeastern Legal Foundation
Georgia Agribusiness Council
Georgia Motor Trucking Association
Corn Refiners Association
National Association of Home Builders
National Oilseed Processors Association
National Petrochemical and Refiners Association
Western States Petroleum Association
The Republican Party of America

Climate Change – Have a look at the following lists. Which side are you on?


You omitted NASA. There is no measurable climate change of Earth's biome at this time nor has there been for roughly 470 years. There will be, in about 100 years, and this is normal for planets such as ours.

Good post.

Robert

So as You can see now in his "Oil Lobby" conspiracy theory he left out a whole shitload of scientists as well, just to name a few..."
Milankovitch
Johannes Kepler
A.Röntgen
Lambert
Beer
Johannes and David Fabricius
John of Worcester, and Averroes
Thomas Harriot and Frisian
Christoph Scheiner
Gustav Spörer
Edward Maunder
Heinrich Schwabe
George Ellery Hal
Horace W. Babcock


Again, since no one by that user name exists here I shall explain it again.
This time let`s go into the Math and the Physics, which are way beyond You, Your Moses Al Gore and his flock of sheep;


solar.gif


Solar flux measured at 20h UTC on 2.8 GHz was 91.2 (increasing 11.0 over the last solar rotation). The planetary A index was 4 (STAR Ap - based on the mean of three hour interval ap indices: 3.6). Three hour interval K indices: 11000122 (planetary), 01011222 (Boulder).

of approximately 100,000 lux or lumens per square meter at the Earth's surface.

To calculate the amount of sunlight reaching the ground, both the elliptical orbit of the Earth and the attenuation by the Earth's atmosphere have to be taken into account. The extraterrestrial solar illuminance (Eext), corrected for the elliptical orbit by using the day number of the year (dn), is given by

4d183d38b0bbdae7bba5ab70c555b879.png


The solar constant includes all types of solar radiation, not just the visible light. It is measured by satellite to be roughly 1.366 kilowatts per square meter (kW/m²)

The total insolation remains almost constant due to Kepler's second law,

6075c64c5e5902bc6d2a2290199fe8a7.png


where A is the "areal velocity" invariant. That is, the integration over the orbital period (also invariant) is a constant.

4b06135b7b3c3ba59f7acd722668d847.png


But the seasonal and latitudinal distribution and intensity of solar radiation received at the Earth's surface also varies.[10] For example, at latitudes of 65 degrees the change in solar energy in summer & winter can vary by more than 25% as a result of the Earth's orbital variation.

The total solar energy absorbed by Earth's atmosphere, oceans and land masses is approximately 3,850,000 exajoules (EJ) per year. In 2002, this was more energy in one hour than the world used in one year.

The amount of solar energy reaching the surface of the planet is so vast that in one year it is about twice as much as will ever be obtained from all of the Earth's non-renewable resources of coal, oil, natural gas, and mined uranium combined.


Now lets see what Your Moses and his high priests of climatology had to say about 2002:


=http://data.giss.nasa.gov/gistemp/2002/]Data.GISS: GISTEMP — Global Temperature Trends, 2002

GISS Surface Temperature Analysis

Global Temperature Trends: 2002 Summation

The 2002 meteorological year is the second warmest year in the period of accurate instrumental data (since the late 1800s). The global surface temperature for 12 months from December 2001 through November 2002 is 0.51°C above the climatological mean (1951-1980 average) in the GISS analysis, which uses meteorological station measurements over land and satellite measurements of sea surface temperature over the ocean.
2002fig1_s.gif
2002fig3_s.gif


And it`s all because of our SUV`s.....they try and tell ME?


dodo%20flat%20earth%202.jpg


Evidence that CO2 is Cause
zFacts-CO2-Temp.gif


The slight downward trend in temperature from about 1945 until about 1975 is due to the increase in Sulfate Aerosols (SO4), largely produced by burning coal that contains sulfur. These cool the earth, and their increase during these years largely canceled the increase in CO2 during the same period.


Fuck You ALL I know MY Math!
And Skookerasbil, Mathew, IanC, Westerwall, etc etc and me are not willing to pay for Your fucking stupidity, that is YOUR PROBLEM all You Rock an Cement heads

Maybe try ripping off a few jungle tribes that cater to witch doctors,

traditional-zulu-witchdoctor-blackpeoplesoutafrica.jpg


They can read correlations between bone/stone patterns and what`s going to happen, just like any of your climatology correlation "scientists" can
You might get lucky with them!....But that`s a no can do either because there is no way to con them into "Greenhouse Gas" taxation either

Good science and math. Keep up the good work
...The sun is by far the biggest driver of climate on this planet and changes in orbit, incline of rotation and output of energy put out by the sun is the driver of the natural cycles. Sure changes in the green house can have effects, but as you pointed out in the 2011 temp thread with math and science is co2 has less and less effect as you go from 300-500 ppm within a log like way. This is caused because water vapor takes up most of co2s wave length.
 
Last edited:
Really? All that BS, yet the first list remains intact. Could it be that Bipolar is using the math and science in the same way that the creationists claim the second law of thermodynamics prevents abiogenisis? If his science is so solid, why do the atmospheric physicists all state that AGW is a fact? In fact, how does the Bi account for the melting of the caps at all?

And many of the scientists, such as Milankovic, are not alive to take part in this controversy. Not only that, his work concerned the orbitual mechnics, not atmospheric physics.
 
The following groups say the danger of human-caused climate change is a … FRAUD:

American Petroleum Institute
US Chamber of Commerce
National Association of Manufacturers
Competitive Enterprise Institute
Industrial Minerals Association
National Cattlemen’s Beef Association
Great Northern Project Development
Rosebud Mining
Massey Energy
Alpha Natural Resources
Southeastern Legal Foundation
Georgia Agribusiness Council
Georgia Motor Trucking Association
Corn Refiners Association
National Association of Home Builders
National Oilseed Processors Association
National Petrochemical and Refiners Association
Western States Petroleum Association
The Republican Party of America

Climate Change – Have a look at the following lists. Which side are you on?


You omitted NASA. There is no measurable climate change of Earth's biome at this time nor has there been for roughly 470 years. There will be, in about 100 years, and this is normal for planets such as ours.

Good post.

Robert

LOL Really fucking stupid there, old chap.

Climate Change: NASA's Eyes on the Earth

And I could sign this as Napoleon Bonoparte. Be just as valid as your claim to be part of NASA.
 
Old Rocks, I think you would be very disappointed to find out the results of a poll of scientists that asked specific questions about AGW. CO2 increase-yes. global warming since the LIA- yes but perhaps not as much as we are being told. CO2 as the driver of increases- one of the factors but unlikely the main one. danger of tipping point- a possibility but unlikely

and they would laugh at you for believing that extreme weather events are (1) increasing or (2) that CO2 is causing them. I guess not all of them, kooks like Hansen or Schneider or Ehrlich crave the attention and fame of being the point man on claims of doom and gloom. charlatans like Mann and Jones see the opportunities for funding and advancement in concocting new theories and manufacturing blighted evidence to support them.

have I asked you recently to explain your position on Mann and Jones using faulty data and methods to make spectacular claims? have you answered somewhere that I didnt notice?
 
The following groups say the danger of human-caused climate change is a … FRAUD:

American Petroleum Institute
US Chamber of Commerce
National Association of Manufacturers
Competitive Enterprise Institute
Industrial Minerals Association
National Cattlemen’s Beef Association
Great Northern Project Development
Rosebud Mining
Massey Energy
Alpha Natural Resources
Southeastern Legal Foundation
Georgia Agribusiness Council
Georgia Motor Trucking Association
Corn Refiners Association
National Association of Home Builders
National Oilseed Processors Association
National Petrochemical and Refiners Association
Western States Petroleum Association
The Republican Party of America

Climate Change – Have a look at the following lists. Which side are you on?


You omitted NASA. There is no measurable climate change of Earth's biome at this time nor has there been for roughly 470 years. There will be, in about 100 years, and this is normal for planets such as ours.

Good post.

Robert

LOL Really fucking stupid there, old chap.

Climate Change: NASA's Eyes on the Earth

And I could sign this as Napoleon Bonoparte. Be just as valid as your claim to be part of NASA.


Poor olfraud when presented with overwhelming evidence that lists of organisations doesn't equal science he resorts to personal insult. Typical result from an uneducated activist moron.

You have outlived your usefulness, time to hit the bricks and find another cause.....I suggest saving the Spotted Owl.
 
Really? All that BS, yet the first list remains intact. Could it be that Bipolar is using the math and science in the same way that the creationists claim the second law of thermodynamics prevents abiogenisis? If his science is so solid, why do the atmospheric physicists all state that AGW is a fact? In fact, how does the Bi account for the melting of the caps at all?

And many of the scientists, such as Milankovic, are not alive to take part in this controversy. Not only that, his work concerned the orbitual mechnics, not atmospheric physics.


meh.........all you ever do s0n is respond with the "real scientists" BS..............

Time for you and the other k00ks to take your bats and balls and go home..............

Anybody who is not part of the religion and checking in on this thread is saying to themselves, "Holy shooooit...........this global warming crap is a racket!!".

This is what the k00ks dont get..........at this point in the debate, their arguments are like Captain Smith asking for the crew to rearrange the chairs on the deck of the Titanic!!
 
Last edited:

Forum List

Back
Top