Navigation
Install the app
How to install the app on iOS
Follow along with the video below to see how to install our site as a web app on your home screen.

Note: This feature currently requires accessing the site using the built-in Safari browser.
More options
You are using an out of date browser. It may not display this or other websites correctly.
You should upgrade or use an alternative browser.
You should upgrade or use an alternative browser.
Biggest jobs drop in nearly 4 years
- Thread starter Nova78
- Start date
edthecynic
Censored for Cynicism
- Oct 20, 2008
- 43,044
- 6,883
- 1,830
I know it is "awful" for CON$ervoFascists to see a graph with unemployment going down, so "awful" in fact that they have to make up lies about people not being counted! It sucks to have to always hope for the worst for this great country!I wonder how many of those available jobs went down because people filled them?????April job openings show biggest drop in nearly 4 years
Job seekers were jolted Tuesday by new government data showing the number of available jobs dropped by 325,000 in April to 3.4 million.
That was the biggest single-month drop since September 2008's falloff of 438,000.
The news comes as markets await Wednesday's Federal Reserve statement on the economy at the end of a two-day meeting of its policy-setting committee. Stocks rose Tuesday in anticipation that the Fed will announce further help for an economy that has shown some signs of slowing.
Thank god the private sector is doing fine ,as Obama says...
View attachment 19644
View attachment 19645
View attachment 19646

Those numbers are just awful in that graph, still way over average for percentage.....and that graph doesn't even include those unemployed so long they have dropped from the numbers used to count the labor force.
itfitzme
VIP Member
"Job seekers were jolted Tuesday by new government data showing the number of available jobs dropped by 325,000 in April to 3.4 million."
So now there are only 3,400,000 jobs instead of 3,725,000 jobs? Really, they were "jolted"? Did the the writer do a phone survey of job seekers, to get their reaction, and find that they were all "jolted"? Who writes this stuff.
So now there are only 3,400,000 jobs instead of 3,725,000 jobs? Really, they were "jolted"? Did the the writer do a phone survey of job seekers, to get their reaction, and find that they were all "jolted"? Who writes this stuff.
PLYMCO_PILGRIM
Gold Member
I wonder how many of those available jobs went down because people filled them?????
Those numbers are just awful in that graph, still way over average for percentage.....and that graph doesn't even include those unemployed so long they have dropped from the numbers used to count the labor force.
Because there's no such thing. There's no maximum time limit to be classified as unemployed. If you're looking for work, you're unemployed...doesn't matter how long.
If you're not looking for work, well, you're not looking for work and therefore not unemployed.
But Ed is a little off in his guessing since hires also went down March-April.
Exactly and the govt determines if you are looking for work by checking if you have checked into the unemployment office stating "Looking for work, didn't find work" to get your check.
As soon as you run out of unemployment you no longer call into unemployment to get your check and are therefore no longer considered looking for employment.
So, as I said the first time, those numbers don't include people who want to work but can no longer collect unemployment.
PLYMCO_PILGRIM
Gold Member
I know it is "awful" for CON$ervoFascists to see a graph with unemployment going down, so "awful" in fact that they have to make up lies about people not being counted! It sucks to have to always hope for the worst for this great country!I wonder how many of those available jobs went down because people filled them?????
Those numbers are just awful in that graph, still way over average for percentage.....and that graph doesn't even include those unemployed so long they have dropped from the numbers used to count the labor force.
What are you ranting on about Ed? I never implied nor said that. I said that those numbers on that graph are just awful as the unemployment is still way over average after 3.5 years of obamanomics.....his plans just didn't work and it totally sucks for me and my fellow americans who have to live under this economy.
I wish those numbers were normal and read 5% or something, I truly do.
Last edited:
PLYMCO_PILGRIM
Gold Member
Then you a) don't know what your looking at because b) you don't understand inflation.
When aggregate inflation is caused by the markets, then we are in a crap load of trouble because it means that there is a sever supply shock across all markets and there is a shortage of goods. Quantity went down, prices went up, and income all stayed the same. But then again, that's the nature of the economy, prices should go up when there is a shortage, right? So, I suppose, it is an okay, crap load of trouble that the money supply isn't suppose to take care of anyways.
On the other hand, when aggregate inflation is caused by increasing the money supply, then all is just fine because real income and real prices moved in the same direction at the same time. Quantity stayed the same, prices went up, and income went up.
So you have seen inflation caused by the markets and a tiny bit of inflation caused by the money supply is meaningless. You are not being realistic.
You are actually being dishonest in your representation of what the USA's economic policies over the last few years have done to the value of the dollar.
Endless borrowing and printing of money has caused a ton of inflation for us, I would like to see my govt stop devaluing the dollar through printing and devaluing the wealth of hte entire nation by borrowing.
Nice spin though.
You claim statistics lies, then you present the statistics of Shadow stats, the biggest piece of lying crap every devised for the internet. You lie about the rate of inflation, then call me a liar.
Like drug addicts think everyone else is doing drugs, child abusers think everyone beats their kids, the biggest liars and cheater are the first ones to call other people liars and cheaters.
Nice try, though.
The reason you must go there is that you don't have any actual facts to present.
Year Inflation Rate
2,011 2.96%
2,010 1.50%
2,009 2.72%
And the methodology is transparent and published at
Consumer Price Index (CPI)
Methodology Resources Consumer Price Index
They have address the ShadowStats B.S. at
Common Misconceptions about the Consumer Price Index: Questions and Answers
Honestly you obviously don't understand how the money supply functions or how inflation works. You honestly don't understand how numbers or measurements work. You are clueless about statistics and couldn't calculate a standard deviation if your life depended on it.
Fundamentally, the entire aggregate economy can be described by the equation of exchange, MV=PQ, where M is the total amount of money in circulation, V is the velocity of money, the turn over for that money in a time period, P is the price of goods, and Q is the quantity.
If Q goes up, M must go up for prices to remain the same.
The entire money supply system is dependent upon borrowing by businesses to invest in expansion. As the economy expands, the money supply expands.
You might want to start there.
Or, by all means, keep on living in your deluded world of conspiracies. Then you can claim everyone is out to get you. Perhaps you should look out for the CIA hiding in an unmarked van across the street, beaming micro wave mind control into your house at night while you sleep. I can sell you some microwave attenuation material to surround your bed with.
Those inflation numbers you just posted completely back up what I claimed.
Please stop being dishonest.
- Thread starter
- #47
About 12.5 million people are still unemployed, and a record 88.4 million people are considered "not in the labor force," according to the BLS,But the decline was mainly due to 342,000 people leaving the labor force, meaning the BLS had stopped counting them as unemployed. The number of employed people in the nation actually fell by 169,000.
Wake -up ....
Wake -up ....
Those numbers are just awful in that graph, still way over average for percentage.....and that graph doesn't even include those unemployed so long they have dropped from the numbers used to count the labor force.
Because there's no such thing. There's no maximum time limit to be classified as unemployed. If you're looking for work, you're unemployed...doesn't matter how long.
If you're not looking for work, well, you're not looking for work and therefore not unemployed.
But Ed is a little off in his guessing since hires also went down March-April.
Exactly and the govt determines if you are looking for work by checking if you have checked into the unemployment office stating "Looking for work, didn't find work" to get your check.
As soon as you run out of unemployment you no longer call into unemployment to get your check and are therefore no longer considered looking for employment.
So, as I said the first time, those numbers don't include people who want to work but can no longer collect unemployment.
Please show me where you found that information. I'm really curious why you think your claim is true. It's not, but I'm more interested in why you think it's true...you certainly didn't get that info from any .gov or .edu or from wikipedia. Why haven't you gone to U.S. Bureau of Labor Statistics ?
itfitzme
VIP Member
You are actually being dishonest in your representation of what the USA's economic policies over the last few years have done to the value of the dollar.
Endless borrowing and printing of money has caused a ton of inflation for us, I would like to see my govt stop devaluing the dollar through printing and devaluing the wealth of hte entire nation by borrowing.
Nice spin though.
You claim statistics lies, then you present the statistics of Shadow stats, the biggest piece of lying crap every devised for the internet. You lie about the rate of inflation, then call me a liar.
Like drug addicts think everyone else is doing drugs, child abusers think everyone beats their kids, the biggest liars and cheater are the first ones to call other people liars and cheaters.
Nice try, though.
The reason you must go there is that you don't have any actual facts to present.
Year Inflation Rate
2,011 2.96%
2,010 1.50%
2,009 2.72%
And the methodology is transparent and published at
Consumer Price Index (CPI)
Methodology Resources Consumer Price Index
They have address the ShadowStats B.S. at
Common Misconceptions about the Consumer Price Index: Questions and Answers
Honestly you obviously don't understand how the money supply functions or how inflation works. You honestly don't understand how numbers or measurements work. You are clueless about statistics and couldn't calculate a standard deviation if your life depended on it.
Fundamentally, the entire aggregate economy can be described by the equation of exchange, MV=PQ, where M is the total amount of money in circulation, V is the velocity of money, the turn over for that money in a time period, P is the price of goods, and Q is the quantity.
If Q goes up, M must go up for prices to remain the same.
The entire money supply system is dependent upon borrowing by businesses to invest in expansion. As the economy expands, the money supply expands.
You might want to start there.
Or, by all means, keep on living in your deluded world of conspiracies. Then you can claim everyone is out to get you. Perhaps you should look out for the CIA hiding in an unmarked van across the street, beaming micro wave mind control into your house at night while you sleep. I can sell you some microwave attenuation material to surround your bed with.
Those inflation numbers you just posted completely back up what I claimed.
Please stop being dishonest.
Yeah, there is the problem the BLS, the BEA, the CBO, MIT, the Federal Reserve, the Social Security Admin, Google, Amazon, everyone is lying except you and ShadowStats. After all, no one would possible notice that prices went up by 14% instead of the reported 2.5%.
Here is a thought. Calculate you own basket of goods prices from last year and this year. Then see what your personal inflation rate was.
itfitzme
VIP Member
Those numbers are just awful in that graph, still way over average for percentage.....and that graph doesn't even include those unemployed so long they have dropped from the numbers used to count the labor force.
Because there's no such thing. There's no maximum time limit to be classified as unemployed. If you're looking for work, you're unemployed...doesn't matter how long.
If you're not looking for work, well, you're not looking for work and therefore not unemployed.
But Ed is a little off in his guessing since hires also went down March-April.
Exactly and the govt determines if you are looking for work by checking if you have checked into the unemployment office stating "Looking for work, didn't find work" to get your check.
As soon as you run out of unemployment you no longer call into unemployment to get your check and are therefore no longer considered looking for employment.
So, as I said the first time, those numbers don't include people who want to work but can no longer collect unemployment.
That is a common misperception.
The unemployment rate is based on an independent phone survey and has nothing to do with the state unemployment offices.
The BLS current population survey data is collected by asking people, "Are you working?, "If not, did you look for work?" and a host of of other questions.
It includes people that are not collecting unemployment and are actively looking for work.
So what has our gov't been doing lately?
Legalizing Illegals for future votes.
Anyone wanna' bet what the Fed will say the "further help" will be?
QE III, or QE III by a different name: "Operation Really Smart Economics Twist".
The FED will never stop "Operation Twist". They plan on refinancing the entire $15 Trillion National Debt to near zero percent locked in for the next 10 years. That way they can jack up interest rates to 20% like Volcker did to stop the inflation they cause without raising government's debt payment. We get to suffer the high interest rates while the government keeps right on spending like a drunken sailor.
About 12.5 million people are still unemployed, and a record 88.4 million people are considered "not in the labor force," according to the BLS,But the decline was mainly due to 342,000 people leaving the labor force, meaning the BLS had stopped counting them as unemployed. The number of employed people in the nation actually fell by 169,000.
Wake -up ....
YUP!
The unemployment rate is based on an independent phone survey and has nothing to do with the state unemployment offices.
Nit-picking: It's not a phone survey, it's a household survey. Households are in the survey for 4 months, out for 8, and back in for 4. The initial interview and the re-entry interview are required to be in-person (there are exceptions if necessary). Subsequent interviews can be by phone if the respondent requests it, but aren't always. About 65% of interviews each month are by phone, the rest are in person.
More nitpicking: Census conducts the actual interviews though the data is sent directly to BLS.The BLS current population survey data is collected by asking people, "Are you working?, "If not, did you look for work?" and a host of of other questions.
Right...the survey doesn't even ask about UI benefits.It includes people that are not collecting unemployment and are actively looking for work.
About 12.5 million people are still unemployed, and a record 88.4 million people are considered "not in the labor force," according to the BLS,But the decline was mainly due to 342,000 people leaving the labor force, meaning the BLS had stopped counting them as unemployed. The number of employed people in the nation actually fell by 169,000.
Wake -up ....
YUP!
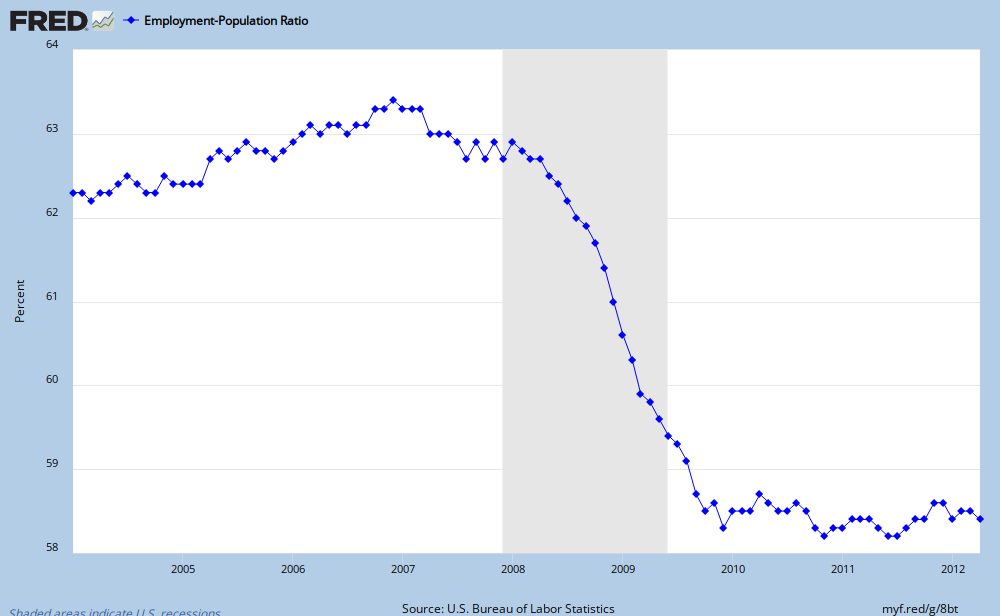
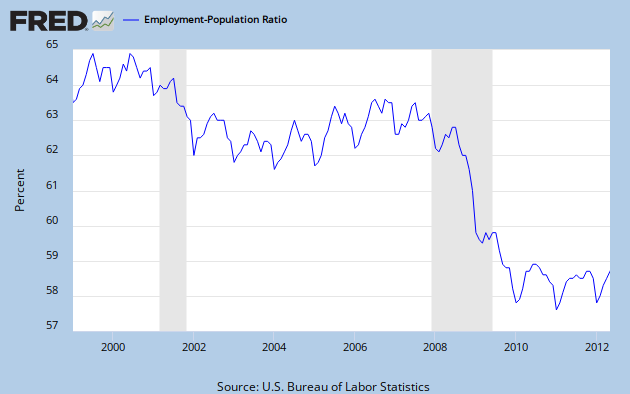
But how much of that drop in emp-pop ratio is labor market factors and how much is demographic change?
Some of the drop in emp-pop and Labor Force participation is due to more retirees, more students, and more stay-home spouses. It's very difficult to isolate and specify how much is due to what, but demographics clearly play a role. And note that the decline started well before the most recent recession:
- Apr 12, 2011
- 3,824
- 761
- 130
Ah yes, the old blame the babyboomer ploy --the oldest trick in the world. Works every time.But how much of that drop in emp-pop ratio is labor market factors and how much is demographic change? Some of the drop in emp-pop and Labor Force participation is due to more retirees...YUP!...342,000 people leaving the labor force, meaning the BLS had stopped counting them as unemployed. The number of employed people in the nation actually fell by 169,000.
Wake -up ...
We hear it a lot from leftists thinking they can explain away the suffering of millions by spouting big words. It won't wash because we now live in the info age and everyone can google. Any google key words "generation unemployment" pops up articles pointing out--
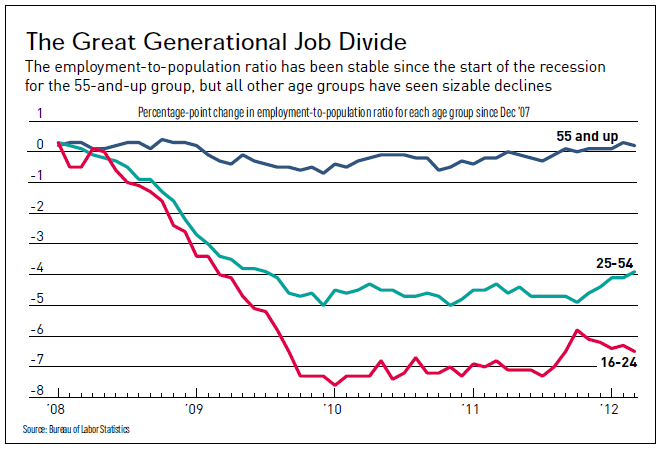
--that blaming retirees doesn't make much sense. If retiring babyboomers were the ones leaving the workforce then we'd be seeing average ages drop among the employed. What does make sense is hiring's off because of Obama's war on hiring, his expressed policy of vengeance against employers. It's a policy that's causing massive unemployment, discouraged workers, and the forsaken young.

itfitzme
VIP Member
The unemployment rate is based on an independent phone survey and has nothing to do with the state unemployment offices.
Nit-picking: It's not a phone survey, it's a household survey. Households are in the survey for 4 months, out for 8, and back in for 4. The initial interview and the re-entry interview are required to be in-person (there are exceptions if necessary). Subsequent interviews can be by phone if the respondent requests it, but aren't always. About 65% of interviews each month are by phone, the rest are in person.
More nitpicking: Census conducts the actual interviews though the data is sent directly to BLS.The BLS current population survey data is collected by asking people, "Are you working?, "If not, did you look for work?" and a host of of other questions.
Right...the survey doesn't even ask about UI benefits.It includes people that are not collecting unemployment and are actively looking for work.
And perfectly good "nit-picks" they are. Either way, it is an independent survey, completely seperate from the state unemployment insurance benefits. The BSL, in doing the CPS, actually contacts and talks to people. I am sure the level of detail, in terms of the survey questions, is far more complicated then my "Are you working?" and "If not, did you look for work?". The concept, though a bit oversimplifed, is accurate enough.
The idea that the unemployment numbers are based on unemployment insurance is very common. I was under the mis-perception until about seven years ago when I learned better. My impression is that I was under the mis-perception since like the late '70s and have no idea where I got the idea.
itfitzme
VIP Member
Ah yes, the old blame the babyboomer ploy --the oldest trick in the world. Works every time.But how much of that drop in emp-pop ratio is labor market factors and how much is demographic change? Some of the drop in emp-pop and Labor Force participation is due to more retirees...YUP!
We hear it a lot from leftists thinking they can explain away the suffering of millions by spouting big words. It won't wash because we now live in the info age and everyone can google. Any google key words "generation unemployment" pops up articles pointing out--
--that blaming retirees doesn't make much sense. If retiring babyboomers were the ones leaving the workforce then we'd be seeing average ages drop among the employed. What does make sense is hiring's off because of Obama's war on hiring, his expressed policy of vengeance against employers. It's a policy that's causing massive unemployment, discouraged workers, and the forsaken young.
Unfortunately, it's not that simple. The population continues to grow. And, the population over 55 also continues to grow. Now, clearly, the under 25 crowd represent a large decline in the employment rolls and a large increase in the NILF. Since the labor force peaked, there has been a structural change such that the under 25 crowd has become less represented in the labor force while the over 55 crowd has become more represented.
This, though, doesn't preclude both becoming more represented in the NILF. I haven't done this side of it yet but the idea is simple. If an age group increases by, say 10%, 5% can go to the labor force with the other 5% going to the NILF. As a result, that age group would increase both in terms of their proportion of the employed and their proportion of the not in the labor force. The same would go for employment.
Due to the fact that the proportion of total population is growing, not so simple as that if one goes up the other must go down.
What I have been able to determine is that, since about 2001, the under 25 crowd has become substantially less represented in the labor force and employment then they were. And, the over 55 crowd has become more represented. This is clearly so.
Still, if the under 25 crowd drops more then the over 55 crowd, even though the over 55 crowd has fallen, the average age for employed would increase.
Because the poplulation is constantly growing and the age group distribution is has changed as well, unemployment and not in the labor force have to be addressed seperately. In fact, because the total population is employed+unemployed+not in labor force, this alone means they have to be addressed seperately.
The basic question is, if the over 55 has grown, then why hasn't their percentage of the employment rolls grown as much as their percentage of the civilian population? Or has it?
- Apr 12, 2011
- 3,824
- 761
- 130
Next I''m expecting you to ask me if I have a couple tens for a five dollar bill you need to break.,...because the total population is employed+unemployed+not in labor force, this alone means they have to be addressed seperately. The basic question is, if the over 55 has grown, then why hasn't their percentage of the employment rolls grown as much as their percentage of the civilian population? Or has it?.
Focus.
The American people are suffering more we see with the 8% uneployment rate becuase millions have been ignored out of the labor force:
The tragedy that can not be dismissed as "older workers retiring" because we now know that it's not the old people quitting but rather the young not being hired.
itfitzme
VIP Member
About 12.5 million people are still unemployed, and a record 88.4 million people are considered "not in the labor force," according to the BLS,But the decline was mainly due to 342,000 people leaving the labor force, meaning the BLS had stopped counting them as unemployed. The number of employed people in the nation actually fell by 169,000.
Wake -up ....
YUP!
Well no shit, it was a recession. Duh!
Similar threads
- Replies
- 5
- Views
- 186
- Replies
- 37
- Views
- 864
- Replies
- 107
- Views
- 1K
- Replies
- 16
- Views
- 806
Latest Discussions
- Replies
- 77
- Views
- 286
- Replies
- 1K
- Views
- 110K
- Replies
- 8K
- Views
- 252K
Forum List
-
-
-
-
-
Political Satire 8093
-
-
-
-
-
-
-
-
-
-
-
-
-
-
-
-
-
-
-
ObamaCare 781
-
-
-
-
-
-
-
-
-
-
-
Member Usernotes 471
-
-
-
-
-
-
-
-
-
-