itfitzme
VIP Member
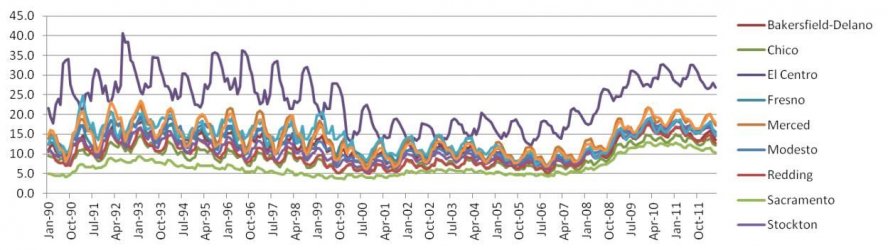
The jobs destruction stems from Democrat enviro-wackos who do stupid shit like turn off the water to the entire California Central Valley destroying over 100,000 jobs instantly. Those jobs left the country & food prices rose for everyone. Higher food prices feeds inflation reducing the amount of stimulus quantitative easing the Fed can do.
That would be all great except, a) where is the data for reduced water deliveries to the central valley? b) where do you come up with 100,000 jobs c) through the recession, deflation was the issue, food prices did no rise. (unless you have something that shows that rising food prices were not reflected in the average cost of living)