itfitzme
VIP Member
About 12.5 million people are still unemployed and a record 88.4 million people are considered "not in the labor force," according to the BLS,But the decline was mainly due to 342,000 people leaving the labor force, meaning the BLS had stopped counting them as unemployed. The number of employed people in the nation actually fell by 169,000.
Wake -up ....
YUP!
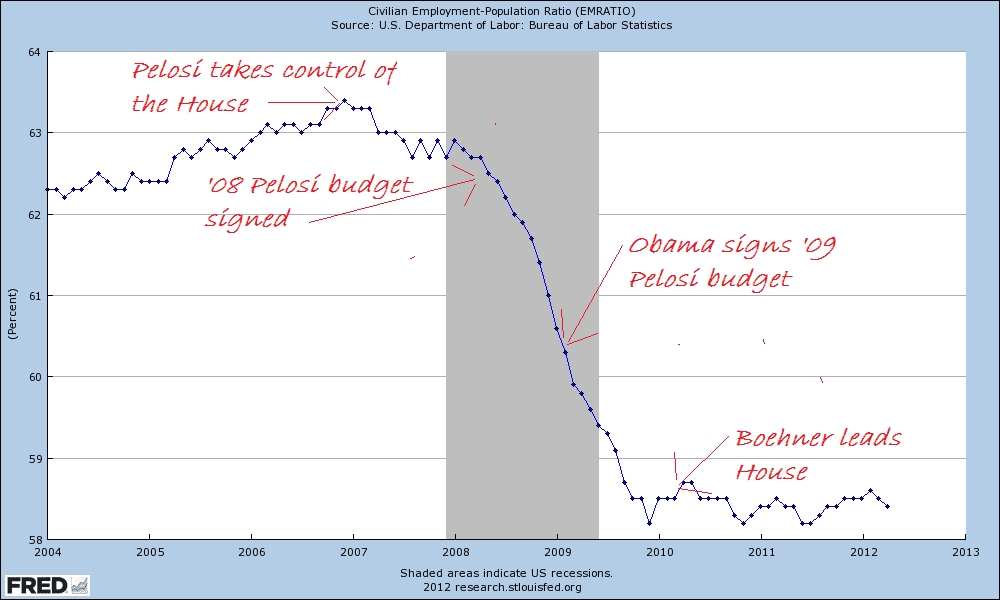
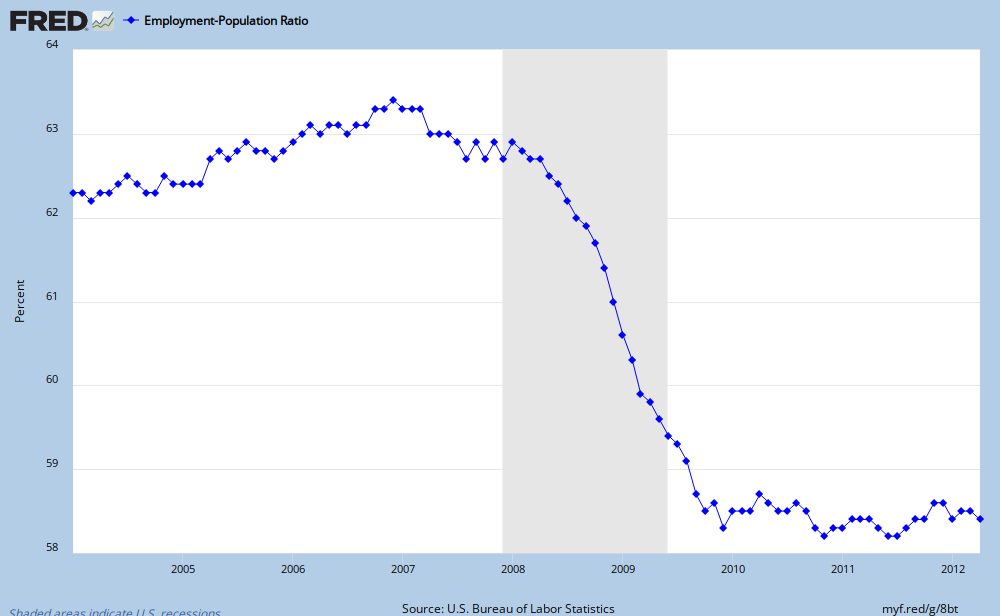
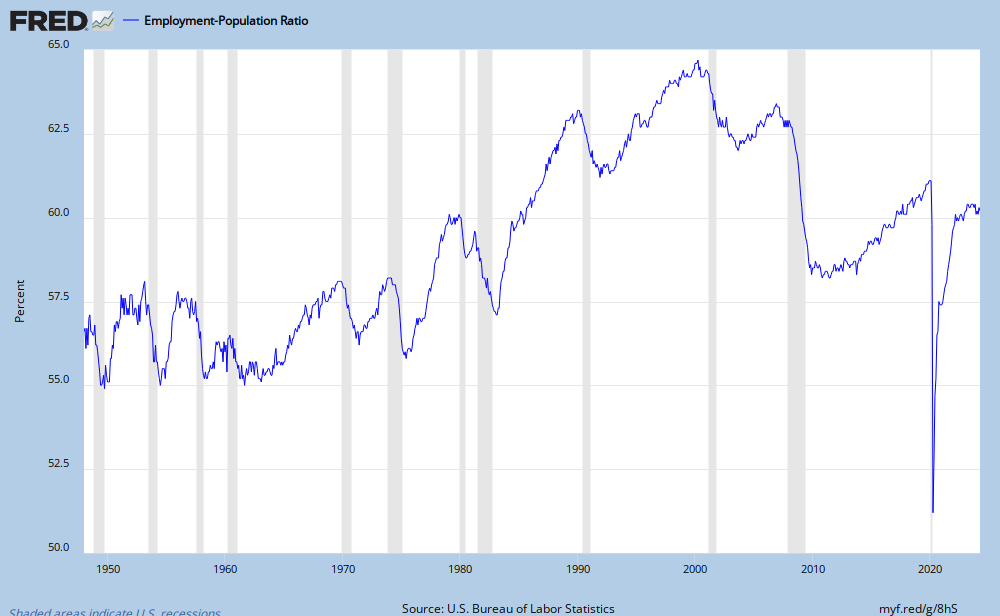
But how much of that drop in emp-pop ratio is labor market factors and how much is demographic change?
Some of the drop in emp-pop and Labor Force participation is due to more retirees, more students, and more stay-home spouses. It's very difficult to isolate and specify how much is due to what, but demographics clearly play a role. And note that the decline started well before the most recent recession:
The way I approached the structural issue is by considering how each age group are represented in employment by comparison to their percentage of the poplulation. Simply, all other things being equal, each should be represented in employment identically to their representation in the population. If age group X represents X% of the population, all other things being equal, they should be X% of employment. Obviously, all things are not equal, so we expect the percentage distributions to be differrent between the age groups. The real question is if the percentage distributions have changed over time. If the age group changes it's proportion of population, it's percentage of employment should change equally. If it was 5% of the population, and represents 10% of the workforce, if the percentage increases to 10%, then it should represent 20% of the workforce. Growth in population should be reflected as the same growth in the work force.
So, I have a representation factor which is the employment percentage divided by the population percentage. All things being equal, this would be equal to one. Of course, all things are not equal, for instance, the 16-19 year age group is obviously a bit underrepresented as many of them are in school. Whatever their percentage is, it should remain stable.
This is how it looks over the years.
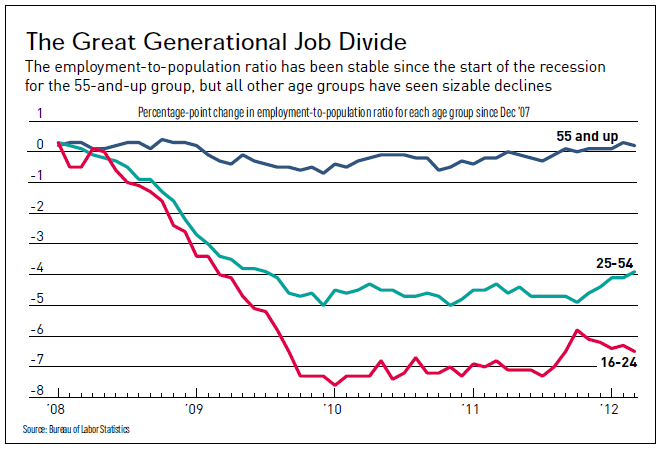
This only represents the structural change. There has been a structural change to how each age group is represented in employment. The over 55 groups have increased in proportion while the under 25 age groups have decreased in proportion.
It basically appears that the aging population has displaced the younger population.
So there is a structural change. What else did you have in mind?
It says nothing about whether the full proportional increase or decrease in the age group's population has been fully taken up or lost in its representation in employment, unemployment, or the NILF.
There is an old joke about two college buddies, both studying economics. Bob switched his major to physics. His buddy quips, "Well, then the average IQ for both the economics department and the physics department have gone up!"
The point is that just because one thing goes up doesn't mean the other must go down. It is very possible for there to be a proportional increase across employment, unemployment and NILF at the same time.
That changes in proportions really confound things.


 Dead people are not counted in population so they would actually help the emp-pop ratio or in LF participation. We have no V shape recovery this time like we usually have after a recession. This is very bad!