Sunsettommy
Diamond Member
- Mar 19, 2018
- 14,896
- 12,529
- 2,400
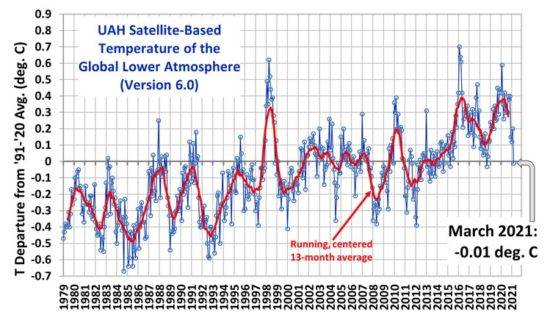
Several months ago I stated that it is going cool down BECAUSE of then coming La-Nina phase, well it has been cooling some now this latest UAH chart shows something not seen in 8 years!
UAH Global Temperature Update for March 2021: -0.01 deg. C
April 2nd, 2021 by Roy W. Spencer, Ph. D.
Excerpt:
Right on time, the maximum impact from the current La Nina is finally being felt on global tropospheric temperatures. The global average oceanic tropospheric temperature anomaly is -0.07 deg. C, the lowest since November 2013. The tropical (20N-20S) departure from average (-0.29 deg. C) is the coolest since June of 2012. Australia is the coolest (-0.79 deg. C) since August 2014.

LINK
UAH Global Temperature Update for March 2021: -0.01 deg. C
April 2nd, 2021 by Roy W. Spencer, Ph. D.
Excerpt:
Right on time, the maximum impact from the current La Nina is finally being felt on global tropospheric temperatures. The global average oceanic tropospheric temperature anomaly is -0.07 deg. C, the lowest since November 2013. The tropical (20N-20S) departure from average (-0.29 deg. C) is the coolest since June of 2012. Australia is the coolest (-0.79 deg. C) since August 2014.
LINK