If the resolution of the Proxy data is outside the range of modern warming rate the paper is statistical junk.
That is why we need to know what the resolution is.
Did you see this?
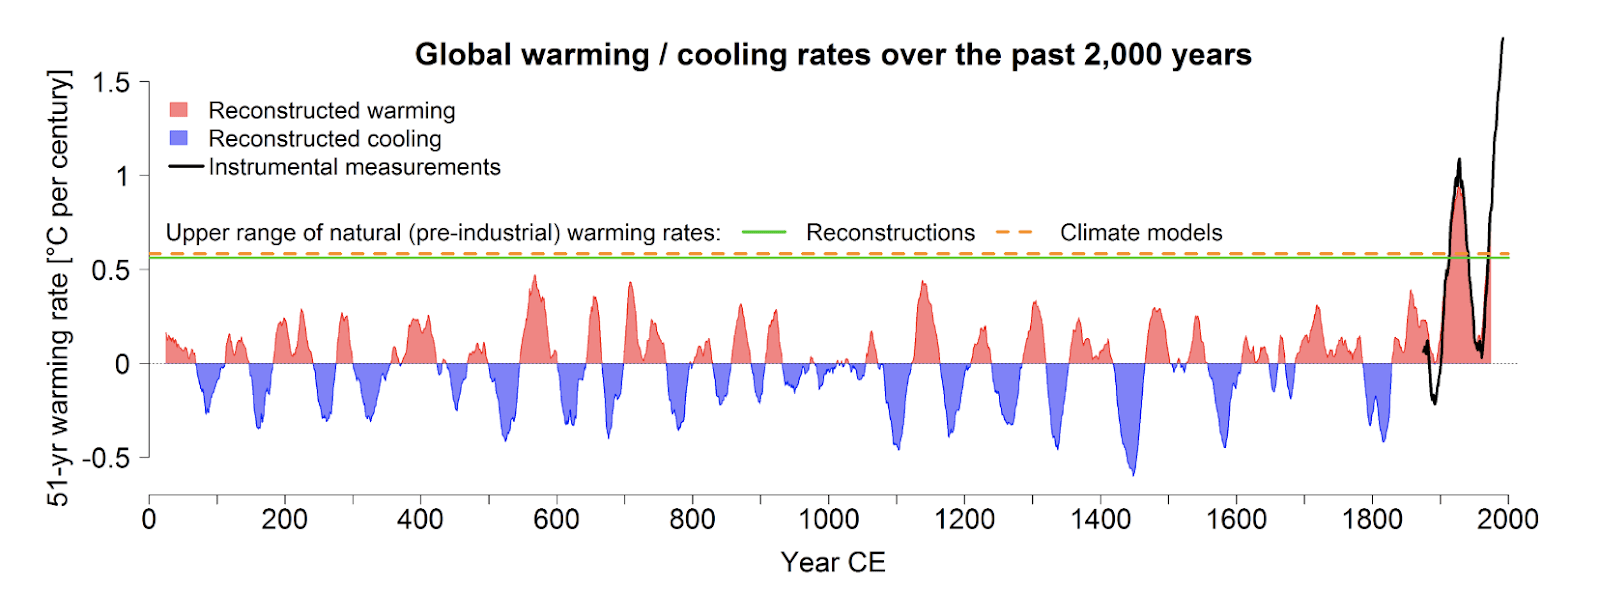
"The researchers relied on a database from the international research consortium PAGES (Past Global Changes,
www.pastglobalchanges.org), which provides a comprehensive overview of climate data from the last 2,000 years, for their investigation of five pre-industrial climate epochs.
In addition to tree rings, it also includes data from ice cores, lake sediments and corals. To really put the results to the test, the team led by Raphael Neukom analyzed these data sets using six different statistical models – more than ever before. This allowed for the calculation of the probability of extremely warm or cold decades and centuries, and not just the calculation of absolute temperatures."
bolding mine
LINK
")


 Huckabee-Sanders kicked out of restaurant because of views