From
What evidence is there for the hockey stick?
An independent assessment of Mann's hockey stick was conducted by the National Center for Atmospheric Research (
Wahl 2007). They reconstructed temperatures employing a variety of statistical techniques (with and without principal components analysis). Their results found slightly different temperatures in the early 15th Century. However, they confirmed the principal results of the original hockey stick - that the warming trend and temperatures over the last few decades are unprecedented over at least the last 600 years.
Changes in surface temperature send thermal waves underground, cooling or warming the subterranean rock. To track these changes, underground temperature measurements were examined from over 350 bore holes in North America, Europe, Southern Africa and Australia (
Huang 2000). Borehole reconstructions aren't able to give short term variation, yielding only century-scale trends. What they find is that the 20th century is the warmest of the past five centuries with the strongest warming trend in 500 years.
Stalagmites (or speleothems) are formed from groundwater within underground caverns. As they're annually banded, the thickness of the layers can be used as climate proxies. A reconstruction of Northern Hemisphere temperature from stalagmites shows that while the uncertainty range (grey area) is significant, the temperature in the latter 20th Century exceeds the maximum estimate over the past 500 years (
Smith 2006).
Historical records of glacier length can be used as a proxy for temperature. As the number of monitored glaciers diminishes in the past, the uncertainty grows accordingly. Nevertheless, temperatures in recent decades exceed the uncertainty range over the past 400 years (
Oerlemans 2005).
Of course, these examples only go back around 500 years - this doesn't even cover the
Medieval Warm Period. When you combine all the various proxies, including ice cores, coral, lake sediments, glaciers, boreholes & stalagmites, it's possible to reconstruct Northern Hemisphere temperatures without tree-ring proxies going back 1,300 years (
Mann 2008). The result is that temperatures in recent decades exceed the maximum proxy estimate (including uncertainty range) for the past 1,300 years. When you include tree-ring data, the same result holds for the past 1,700 years.
Paleoclimatology draws upon a range of proxies and methodologies to calculate past temperatures. This allows independent confirmation of the basic hockey stick result: that the past few decades are the hottest in the past 1,300 years.
As to his data:
From
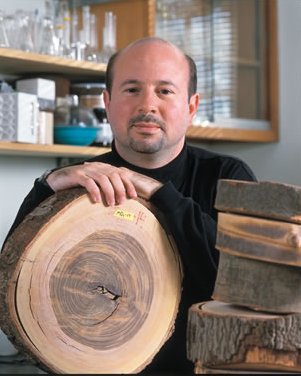
Behind the Hockey Stick
More recently, Mann battled back in a 2004 corrigendum in the journal
Nature, in which he clarified the presentation of his data. He has also shown how errors on the part of his attackers led to their specific results. For instance, skeptics often cite the Little Ice Age and Medieval Warming Period as pieces of evidence not reflected in the hockey stick, yet these extremes are examples of regional, not global, phenomena. "From an intellectual point of view, these contrarians are pathetic, because there's no scientific validity to their arguments whatsoever," Mann says. "But they're very skilled at deducing what sorts of disingenuous arguments and untruths are likely to be believable to the public that doesn't know better."
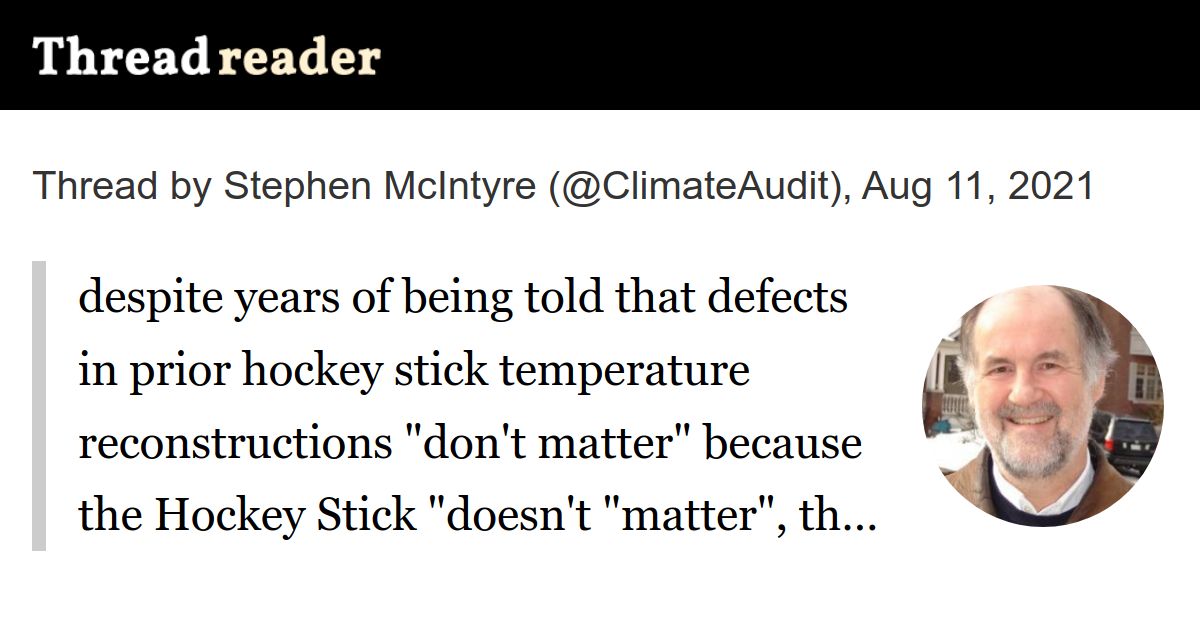
and here is a link to the corrigendum itself which includes a full listing of his data, sixteen years ago. Amazing how long a lie can live.
Nature 392, 779–787 (1998). It has been drawn to our attention (S. McIntyre and R. McKitrick) that the listing of the ‘proxy’ data set in the Supplementary Information published with this Article contained several errors. In Table 1 we provide a list of the records that were either mistakenly...

www.nature.com
 threadreaderapp.com