What is the magnitude of this effect compared to the simple maxing out of consumption of goods and the increase of services to the total consumption basket?...
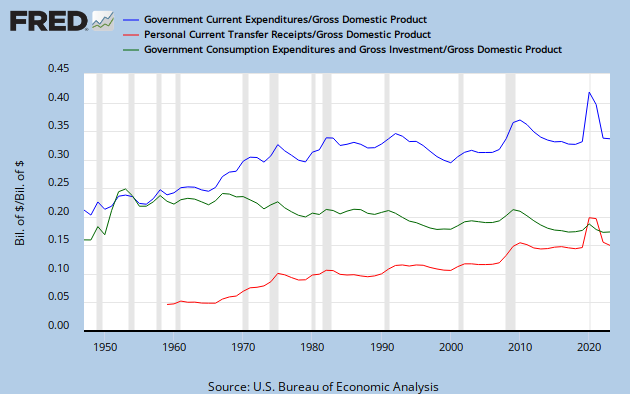
the apparent change in proportions for goods and services has NOT been do the detriment of goods and production. It has been a proportional shift as production of goods has increased while services increased even more so... the service sector has grown considerably by comparison to the modest growth in production of goods.
Inexpertly, the (macro-)economy can be partitioned, into "necessities" ("meat & potatoes", the CPI basket of groceries,
non-durable Consumption expenditures); and "surplus production". That "surplus production" is discretionary, and can be "butter, plow-shears & cars" or "guns, swords, and tanks". When government policies "shift" discretionary production in the economy, away from the former, and towards the latter (say); non-discretionary "necessities" are unchanged ("people still need to eat"). Thus, the mathematical
Q vector
rotates around the "necessities" vector component, which is like a mathematical "axis" of the economy.
Now, over the past half-century, US production of "goods" has grown, but only modestly. Meanwhile, US "services" have grown, profoundly. Thus, the mathematical "trajectory" of the US production
Q vector has "veered away" from goods; and towards services:
Hypothetically, the US economy could have "gone straight ahead" towards far more goods, and fewer services, than it actually did do.
I.e. the US economy could have evolved, to be at a different point, on its Production Possibilities Frontier (PPF). All of this specific "
direction" information, encoded in the
Q vector, is lost, when only the overall general
magnitude "Q" of aggregate production is plotted, on AD/AS charts.