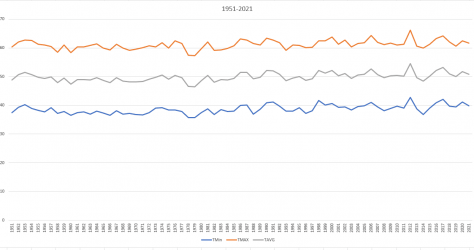
Temps in the US 1951-2021

turbofish

Gold Member
Apr 19, 2021
349
464
203
OK, you have seen the headlines.
2021 8th warmest year on record.
2021 record breaking year
6th warmest year
The hottest eight years on record were the last eight years

Just went into my database, deleted the entire year of 2021 [only went until June plus lots of updates] and finished updating for the temps from 1951-2021 across the 48 states. Again, Hawaii and Alaska are left out of this NOAA dataset. So far, I'm up to 80,570,724 rows since I keep track of daily county temps. The data is straight from our government - NOAA

Have you ever known the media to tell you the truth?
1951-2021.png
 

Attachments

  • 1951-2021.png
    1951-2021.png
    12.4 KB · Views: 42
Last edited:
OK, you have seen the headlines.
2021 8th warmest year on record.
2021 record breaking year
6th warmest year
The hottest eight years on record were the last eight years

Just went into my database, deleted the entire year of 2021 [only went until June plus lots of updates] and finished updating for the temps from 1951-2021 across the 48 states. Again, Hawaii and Alaska are left out of this NOAA dataset. So far, I'm up to 80,570,724 rows since I keep track of daily county temps. The data is straight from our government - NOAA

Have you ever known the media to tell you the truth?
View attachment 589728
Oh my, another dumb fuck denier chimes in and demonstrates he is not capable of reading a simple graph.

1642560744407.png


Shows exactly the same thing, just with a different scale. And we are seeing the results of this increase now with increasing extreme weather events every decade.
 
I'm the only one here who has actually looked at the data.

The only one

You looked at a chart provided by someone else because you don't have the skills or the equipment to handle 80 million rows of data. Me posting my SQL scripts or my SSIS package would be lost on you. You most likely haven't heard of OLAP or OLTP.
I have and it is what I specialize in.
Personally, I don't give a crap about the temps in some place that I have no control over.
Rising temps in Russia? I have no control over that so it doesn't concern me. It can't because again, I have no control over that or have any control of the reporting of the data.
I started this whole quest because I kept on hearing about global warming but couldn't figure out where it was actually happening. I ended up with a dataset that included only the 'lower 48' but then again, that was OK with me. I don't live in South Africa, don't live in AK but I am able to look at where climate change is actually happening.
Turns out, it isn't happening in my state in general but more in my county.
There are so many factors.
Example: my state over 71 years [Arkansas]


Ark.jpg

Notice the flat trend levels overall.
Now my county of Benton [home town of Walmart]
BentonCounty.jpg

More of an upward trend but then again, our population has grown from around 10K people to over 250K with the majority happening in the past 30 years.
How about Dallas Tx
DallasTx.jpg

increase of around 1.5F over 71 years.
orange county CA
OrangeCA.jpg


Big growth of over 2.5 degrees but also notice the past few years as it is decreasing. Population decrease?

OK, I do have population growth, population density, economic trends to throw in.
Stuff I find fun.

I will work on a way to share my Power BI file that will allow people without much knowledge of working with vast amounts of data to play with your state/county. It isn't too big, only around 9 MG after grouping the data by year/state/county. Much smaller than big MS-SQL 2016 DB of around 8 GB including indexes

DB.jpg
 
MultnomahOR.jpg

Just for you - Multnomah County OR [Portland]. Around 1.5F change in 71 years
 
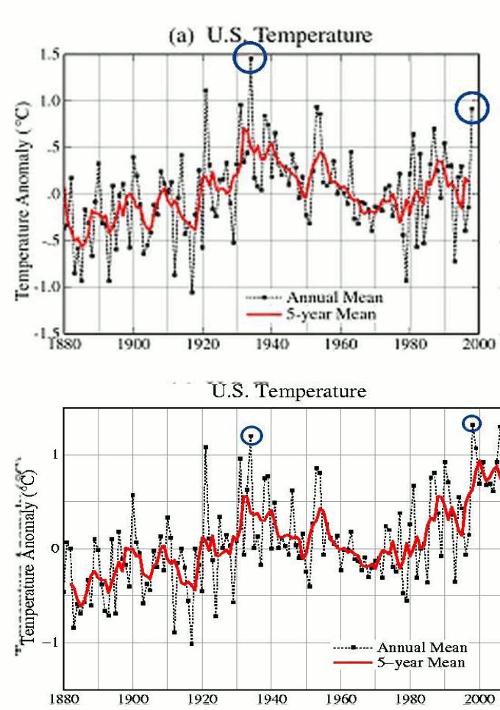
Wow, another poster child for Dunning-Kruger. Note the sources of the two charts in Posts #1 and #2. Both NOAA. Both show the same thing. And you received your Phd in Climatology and Statistical Analysis from Yale or Harvard? Yes, we have seen significant warming in Oregon. The mountains I saw when I was a child in the late 40's and 50's in Eastern Oregon now get their snow later and it melts off earlier. In the late 60's, I worked for the Forest Service for a few years, and fought wildfires in the summer. We never saw the kind of fire activity there that we have seen in the last decade. And that is pretty much the same for all the Western States.
 
Oh my, another dumb fuck denier chimes in and demonstrates he is not capable of reading a simple graph.

View attachment 589890

Shows exactly the same thing, just with a different scale. And we are seeing the results of this increase now with increasing extreme weather events every decade.

Graph fakery....progressives do it all the time only this meathead doesn't get that squeezing the both axis makes shit LOOK waaaaaaaay more worse than it is. These people are prone to being duped by graph hysteria. Most rubes in the public easily bamboozled by the fakery.

It's as ghey as it gets

Also...take a gander on what these meatheads define as "hotter".

FIm2ODWX0AQLPwY.jpeg
 
Even at an accelerated rate it will take billions of years for the core to cool. I'm sure you knew that though. 😉
 
Just went into my database, deleted the entire year of 2021 [only went until June plus lots of updates] and finished updating for the temps from 1951-2021 across the 48 states. ... So far, I'm up to 80,570,724 rows since I keep track of daily county temps. The data is straight from our government - NOAA Have you ever known the media to tell you the truth?
View attachment 589728
Isn't that Odd.
This 1951-2021 looks alot different than you MASSAGED CRAP.


1642612699280.png

`
 
Last edited:
Wow, another poster child for Dunning-Kruger. Note the sources of the two charts in Posts #1 and #2. Both NOAA. Both show the same thing. And you received your Phd in Climatology and Statistical Analysis from Yale or Harvard? Yes, we have seen significant warming in Oregon. The mountains I saw when I was a child in the late 40's and 50's in Eastern Oregon now get their snow later and it melts off earlier. In the late 60's, I worked for the Forest Service for a few years, and fought wildfires in the summer. We never saw the kind of fire activity there that we have seen in the last decade. And that is pretty much the same for all the Western States.
From Deming himself, the one who taught SPC to Yale and Harvard
 
Official weather records go back about a hundred years with primitive instruments. In geological terms it's only been a drop in the bucket since the last ice age. You can put a 24/7 temperature sensor device on a blacktop parking lot in August and rig the statists to indicate record heat. Back in the 70's NOAA "scientists" were worried about a new ice age. Failed politician Al Gore who had zero background in science set up a scam selling "carbon credits" and (mostly) lefties figured out that they could make billions blackmailing the U.S. over an unproven theory.
 
Oh my, another dumb fuck denier chimes in and demonstrates he is not capable of reading a simple graph.

View attachment 589890

Shows exactly the same thing, just with a different scale. And we are seeing the results of this increase now with increasing extreme weather events every decade.

Stop listening to Bernie Madoff accounting!
 
Stop listening to Bernie Madoff accounting!
That is right from NOAA.
Ostensibly where the OP said he got HIS numbers.
NOAA is not Bernie Madoff.

YOU, OTOH are a 100% Troll and a complete waste of time.
A Stupid Creationist as well posting/TROLLING in Sci threads!
NEVER any info or debate.

You're on IGNORE as of this moment.
(joining jc456, Skookerasbil, ToddsterPatriot, etc)

`
 
Last edited:
China is beyond a doubt the biggest polluter on the planet but the extortion based left can't make any money blackmailing China and they would probably get arrested for demonstrating so they continue to whine about the U.S.
 
China is beyond a doubt the biggest polluter on the planet but the extortion based left can't make any money blackmailing China and they would probably get arrested for demonstrating so they continue to whine about the U.S.
That's a perverted take based on your hyper-partisanship.
Everyone wants China (and other under-developed nations like India) to stop their horrible polluting and energy mix.
And w should press them harder.
But they point out they use nowhere near the energy per person we do, and they have a 'right' to get more of their populations out of poverty.
Nonetheless, we should Press them much harder to change the mix of their old and new plants to a more green one.

Of course, "the left" can't tell China what to do, they only have any power here and in the EU. You know, with decent Liberal populations.

Grow up little MAGAt.
`
 
China is beyond a doubt the biggest polluter on the planet but the extortion based left can't make any money blackmailing China and they would probably get arrested for demonstrating so they continue to whine about the U.S.
The Green New Deal Is a Dead Man's Hand

"Pollution" is a dishonest word taken from a pagan superstition. Natural air, which the Unabomber cult calls "Clean Air" is the most toxic of all atmospheres humans have had to overcome.

Pollution is antiseptic. The modernized industrialized cities in China are the reason it has had fewer than 5,000 dead from the Globalists' cronyvirus. Don't be a sucker and think that "pollution" is a dirty word. Where there's smoke, there's fire. The Green Monsters have taken the fire out of economic progress.
 
That's a perverted take based on your hyper-partisanship.

`
If Someone Doesn't Totally Confirm As Good What the Left Says Is Bad, He Unconsciously Lets Them Manipulate Him

He's actually a partisan on your side, since your powerful cult has convinced him that there's something wrong with pollution. Only the primitive and mindless superstition that Nature is supernatural would make someone accept your terms.
 

Forum List

Back
Top