That is not what AGW is about. The earth's climate is a complex interaction. The
average overall temperature can increase while certain areas remain the same or even slightly cool.
Let us take a class of male students in 3rd grade. The average HEIGHT of the kids is about 4'. That does NOT MEAN that every member of the class is exactly 4' tall. Far from it. It means that the DISTRIBUTION of heights has an average that is 4'
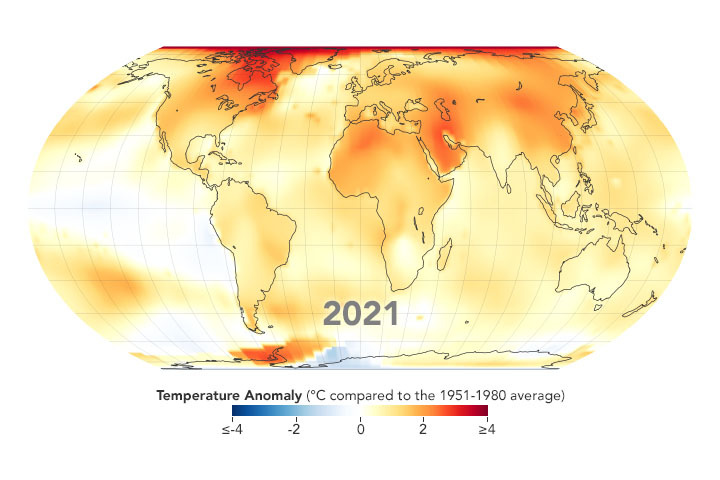
Same with global climate change. The AVERAGE global temperature is NOT THE SAME VALUE AS EVERY POINT ON THE GLOBE.
"As the maps show, global warming does not mean temperatures rise everywhere at every time by same rate. Temperatures might rise 5 degrees in one region and drop 2 degrees in another. For instance, exceptionally cold winters in one place might be balanced by extremely warm winters in another part of the world. Generally, warming is greater over land than over the oceans because water is slower to absorb and release heat (
thermal inertia). Warming may also differ substantially within specific land masses and ocean basins." (
SOURCE)
vide supra
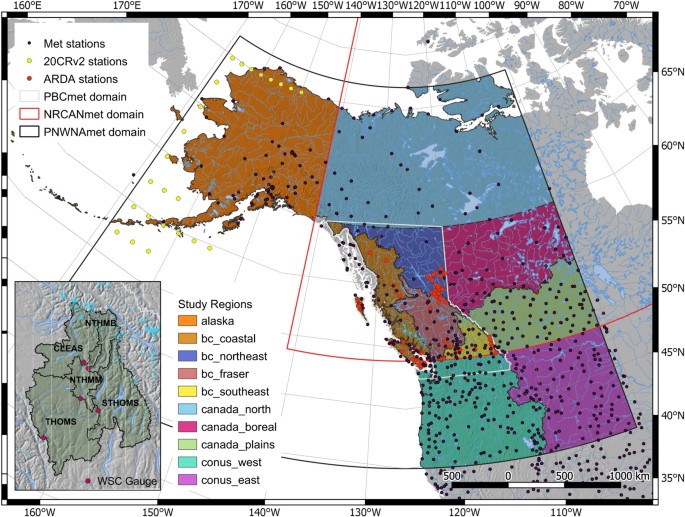
That isn't even how global warming is determine. The temperature station data is compared to a baseline data set (this results in a "temperature anomaly") and it is
GRID AVERAGED with other station points around it to cover a much larger region.