And you have what sort of evidence that puts a stop to the process of warming out of the little ice age and becoming man made warming?
The fact that there's another cooling period afterwards pounds in the coffin nails on that theory.
Miraculous, that "LIA recovery". By your standards, it explains the post-LIA warming and the post-LIA cooling. As your theory there is unfalsifiable, it's pseudoscience nonsense.
And you have what sort of evidence that places such constraints on warming and cooling periods? Anything at all other than your based cult opinion?
Then there is the fact that we never got up to the temperature of the period before the LIA began...we have no idea what brings on warming or cooling periods and paleoclimatology has shown us that there is little rhyme or reason to the period or magnitude of either warming or cooling periods...
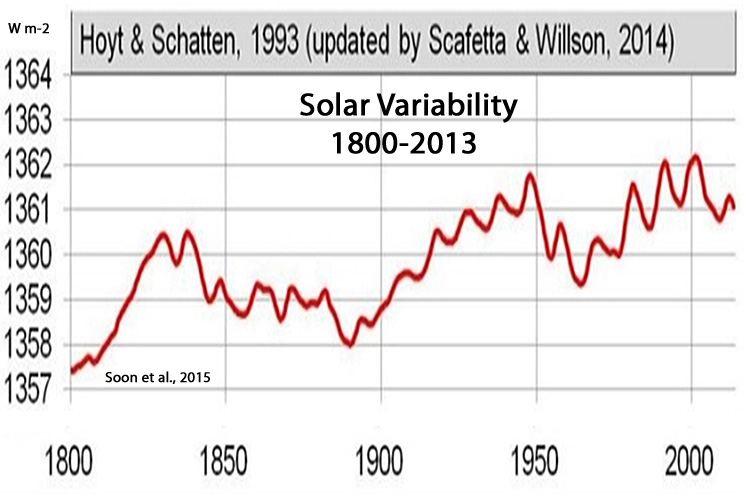
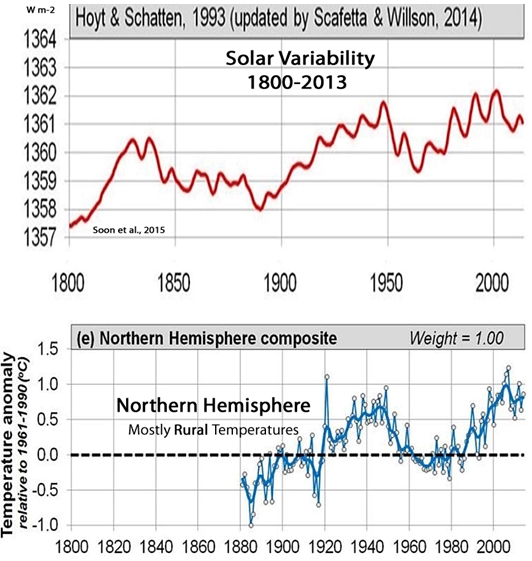
I doubt that you wouild be interested...cult dupe and all, but I just perused a recent paper on a revaluation of some alarmist pseudoscience regarding TSI and for those who actually are interested in science, it is a real eye opener on the bullshit that is happening within climate science... It shows, as I have already stated that most of the warming that we have experienced is due to changes in TSI of the sun...
https://www.hindawi.com/journals/aa/2019/1214896/
Clips:
“The PMOD rationale for using models to alter the Nimbus7/ERB data was to compensate for the sparsity of the ERBS/ERBE data and conform their gap results more closely to the proxy predictions of solar emission line models of TSI behavior.”
“PMOD’s modifications of the published ACRIM and ERB TSI records are questionable because they are
based on conforming satellite observational data to proxy model predictions.”
“The PMOD trend during 1986 to 1996 is biased downward by scaling ERB results to the rapidly degrading ERBE results during the ACRIM-Gap using the
questionable justification of agreement with some TSI proxy predictions first proposed by
Lee IIIet al.(1995).”
“
PMOD misinterpreted and erroneously corrected ERB results for an instrument power down event.”
“The dangers of utilizing ex-post-facto corrections by those who did not participate in the original science teams of satellite experiments are that erroneous interpretations of the data can occur because of a lack of detailed knowledge of the experiment and
unwarranted manipulation of the data can be made based on a desire to support a particular solar model or some other nonempirical bias. We contend that the PMOD TSI composite construction is compromised in both these ways.”
“
[O]ur scientific knowledge could be improved by excluding the more flawed record from the composite. This was the logic applied by the ACRIM team. In point of fact PMOD failed to do this, instead selecting the ERBE results that were known to be degraded and sparse,
because that made the solar cycle 21–22 trend agrees with TSI proxy models and the CAGW explanation of CO2 as the driver of the global warming trend of the late 20th century.”
“The consistent downward trending of the PMOD TSI composite is negatively correlated with the global mean temperature anomaly during 1980–2000. This has been
viewed with favor by those supporting the CO2 anthropogenic global warming (CAGW) hypothesissince it would minimize TSI variation as a competitive climate change driver to CO2, the featured driver of the hypothesis during the period (cf.: [
IPCC, 2013,
Lockwood and Fröhlich, 2008]).”
“Our summary conclusion is that the objective evidence produced by all of the independent TSI composites [
3,
5,
6,
9] agrees better with the cycle-by-cycle trending of the original ACRIM science team’s composite TSI that shows an increasing trend from 1980 to 2000 and a decreasing trend thereafter.
The continuously downward trending of the PMOD composite and TSI proxy models is contraindicated.”
Soon et al., 2015
“
ACRIM shows a 0.46 W/m2 increase between 1986 and 1996 followed by a decrease of 0.30 W/m2 between 1996 and 2009. PMOD shows a continuous, increasing downward trend with a 1986 to 1996 decrease of 0.05 W/m2 followed by a decrease of 0.14 W/m2 between 1996 and 2009.
The RMIB composite agrees qualitatively with the ACRIM trend by increasing between the 1986 and 1996 minima and decreasing slightly between 1996 and 2009.”
“ACRIM composite trending is well correlated with the record of global mean temperature anomaly over the entire range of satellite observations (1980–2018) [
Scafetta. 2009]. The climate warming hiatus observed since 2000 is inconsistent with CO2 anthropogenic global warming (CAGW) climate models [
Scafetta, 2013,
Scafetta, 2017]. This points to
a significant percentage of the observed 1980–2000 warming being driven by TSI variation[
Scafetta, 2009,
Willson, 2014,
Scafetta. 2009]. A number of other studies have pointed out that
climate change and TSI variability are strongly correlated throughout the Holocene including the recent decades (e.g.,
Scafetta, 2009,
Scafetta and Willson, 2014,
Scafetta, 2013,
Kerr, 2001,
Bond et al., 2001,
Kirkby, 2007,
Shaviv, 2008,
Shapiro et al., 2011,
Soon and Legates, 2013,
Steinhilber et al., 2012,
Soon et al., 2014).”
“The global surface temperature of the Earth increased from 1970 to 2000 and remained nearly stable from 2000 and 2018. This pattern is
not reproduced by CO2 AGW climate models but correlates with a TSI evolution with the trending characteristics of the ACRIM TSI composite as explained in Scafetta [
6,
12,
27] and Willson [
7].”
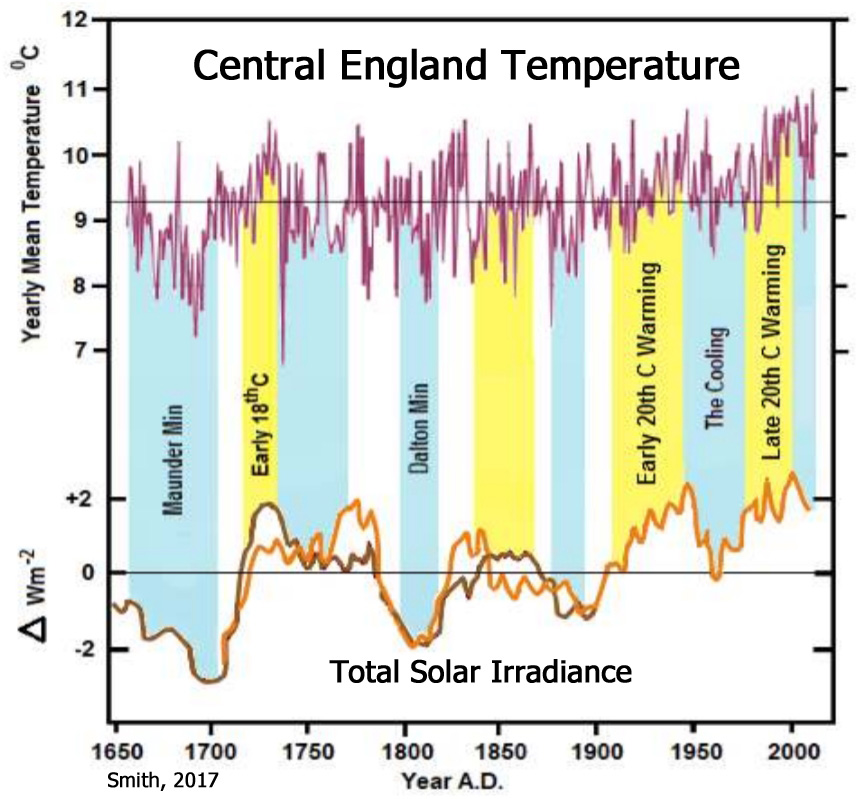
Smith, 2017
Here is some more...
The science is out there hairball...and at long last, it is getting through the gatekeepers...their influence is in steep decline and the rats are jumping ship...soon your priests are going to be thrown under the bus...what will you do then?