RollingThunder
Gold Member
- Mar 22, 2010
- 4,818
- 522
- 155
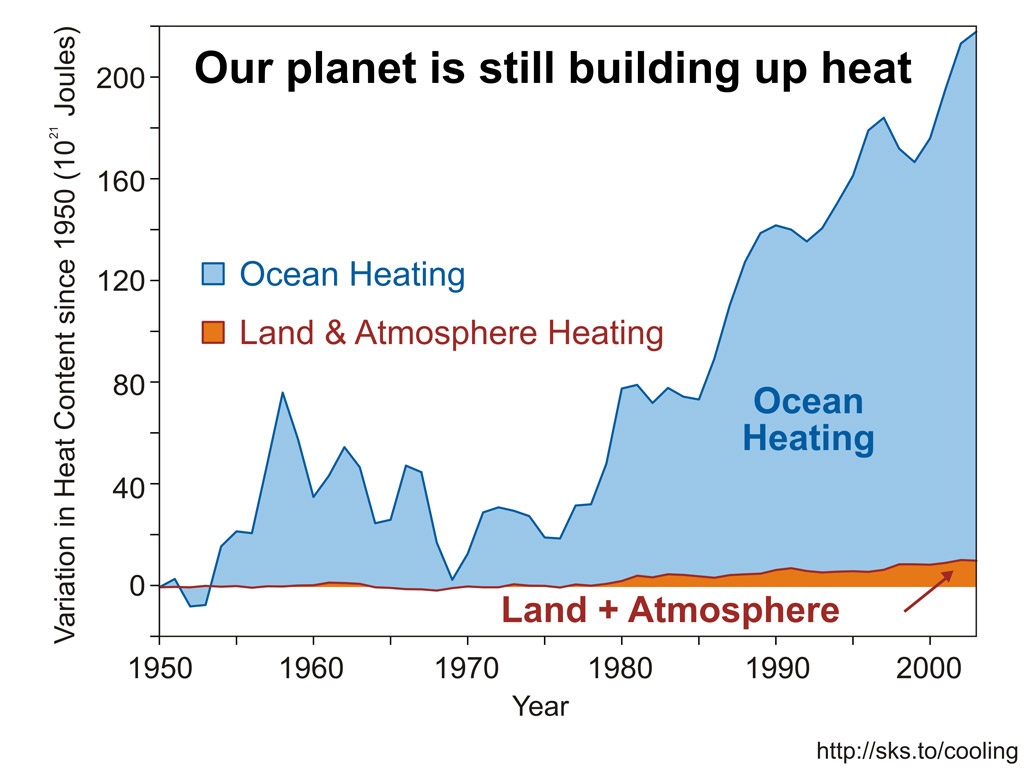
The Earth is warming and had been for many decades now. As long as atmospheric carbon dioxide levels remain severely elevated as they are now, less energy will be able to escape away into space than is being received from the sun every day, so our planet will continue to warm up a little more every year.
Variations in several natural climate factors can, to some degree, either enhance or mask the reflection of the underlying continuous warming trend in the surface air temperature records. Surface air temperatures account for less than 3% of the sun's energy the Earth is receiving, while the oceans are absorbing over 90% of the sun's heat. The oceans have been warming up faster and at greater depths in recent years as even more of the heat energy that the excess CO2 is trapping has been getting transferred into the oceans by repeated La Niña events and some wind pattern changes.
Even in just the surface air temperature record though, the warming trend is very clear. Good instrumental surface air temperature records extend back to 1880 in many places, and much farther in certain specific locales.
Here are some examples of the undeniable warming trend, that has not "paused" at all.
* This last January, 2014, was the 4th warmest January on record.
* Last November, 2013, was THE warmest November on record going back to at least 1880.
* January was the ninth consecutive month (since May 2013) with a global monthly temperature among the 10 highest for its respective month in the entire temperature record.
* January was the 38th consecutive January with global average temperatures above the entire twentieth century average for January.
* January was the 347th consecutive month (almost 29 years) with average temperatures above the 20th century global average temperature for all Januarys. Last month, March, was the 349th straight month with global average temperatures higher than the 20th century average for that month.
* 2013 was the 4th warmest year on record.
* 2010 is tied with 2005 as the warmest years on record.
* 2001 to 2010 was the warmest decade on record.
* All of the warmest years on record, going back to at least 1880, have happened since 1998.
* All of the coldest years since 1998 are still warmer than all of the hottest years before 1998.
* The Arctic ice cap is still rapidly melting away.
* Large areas northern permafrost are still rapidly melting.
* Greenland and Antarctica are still losing ice mass at increasing rates.
* The large majority of mountain glaciers are still rapidly melting and disappearing.
* Sea levels are still rising at an accelerating rate.
GLOBALLY, this shows the rising surface air temperatures.
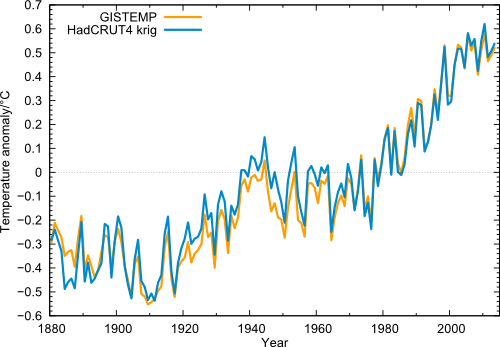
Global temperature (annual values) in the data from NASA GISS (orange) and from Cowtan & Way (blue), i.e. HadCRUT4 with interpolated data gaps.
One can clearly see the extreme year 1998, which (thanks to the record-El Niño) stands out above the long-term trend like no other year. But even taking this outlier year as starting point, the linear trend 1998-2013 in all four data sets is positive. Also clearly visible is 2010 as the warmest year since records began, and the minima in the years 2008 and 2011/2012. But just like the peaks are getting higher, these minima are less and less deep. (source: RealClimate)
Forget The Local Cold: Worldwide, It Was Another Hot January
NPR
by SCOTT NEUMAN
February 21, 2014
January will go down in the weather history books as the fourth-warmest on record. That's right. No matter how brutal the winter was in North America, especially the Eastern half, it was balanced by warm temperatures elsewhere on the planet. The National Oceanic and Atmospheric Administration's National Climate Data Center says that last month marks the 38th consecutive January and the 347th consecutive month (almost 29 years) that global temperatures have been above the average for the 20th century. The last time the average temperature was below-average in January was in 1976 and the last time there was a below-average month was February 1985. Record keeping goes back to 1880.
NOAA says the combined global land and ocean surfaces for last month was 54.8°F (12.7°C), or 1.17°F (0.65°C) above the 20th century January average of 53.6°F (12.0°C):
The Weather Channel asks "in a warming world, how can it be so bitterly cold? Deke Arndt, a scientist at the National Climatic Data Center explains":
Variations in several natural climate factors can, to some degree, either enhance or mask the reflection of the underlying continuous warming trend in the surface air temperature records. Surface air temperatures account for less than 3% of the sun's energy the Earth is receiving, while the oceans are absorbing over 90% of the sun's heat. The oceans have been warming up faster and at greater depths in recent years as even more of the heat energy that the excess CO2 is trapping has been getting transferred into the oceans by repeated La Niña events and some wind pattern changes.
Even in just the surface air temperature record though, the warming trend is very clear. Good instrumental surface air temperature records extend back to 1880 in many places, and much farther in certain specific locales.
Here are some examples of the undeniable warming trend, that has not "paused" at all.
* This last January, 2014, was the 4th warmest January on record.
* Last November, 2013, was THE warmest November on record going back to at least 1880.
* January was the ninth consecutive month (since May 2013) with a global monthly temperature among the 10 highest for its respective month in the entire temperature record.
* January was the 38th consecutive January with global average temperatures above the entire twentieth century average for January.
* January was the 347th consecutive month (almost 29 years) with average temperatures above the 20th century global average temperature for all Januarys. Last month, March, was the 349th straight month with global average temperatures higher than the 20th century average for that month.
* 2013 was the 4th warmest year on record.
* 2010 is tied with 2005 as the warmest years on record.
* 2001 to 2010 was the warmest decade on record.
* All of the warmest years on record, going back to at least 1880, have happened since 1998.
* All of the coldest years since 1998 are still warmer than all of the hottest years before 1998.
* The Arctic ice cap is still rapidly melting away.
* Large areas northern permafrost are still rapidly melting.
* Greenland and Antarctica are still losing ice mass at increasing rates.
* The large majority of mountain glaciers are still rapidly melting and disappearing.
* Sea levels are still rising at an accelerating rate.
GLOBALLY, this shows the rising surface air temperatures.
Global temperature (annual values) in the data from NASA GISS (orange) and from Cowtan & Way (blue), i.e. HadCRUT4 with interpolated data gaps.
One can clearly see the extreme year 1998, which (thanks to the record-El Niño) stands out above the long-term trend like no other year. But even taking this outlier year as starting point, the linear trend 1998-2013 in all four data sets is positive. Also clearly visible is 2010 as the warmest year since records began, and the minima in the years 2008 and 2011/2012. But just like the peaks are getting higher, these minima are less and less deep. (source: RealClimate)
Forget The Local Cold: Worldwide, It Was Another Hot January
NPR
by SCOTT NEUMAN
February 21, 2014
January will go down in the weather history books as the fourth-warmest on record. That's right. No matter how brutal the winter was in North America, especially the Eastern half, it was balanced by warm temperatures elsewhere on the planet. The National Oceanic and Atmospheric Administration's National Climate Data Center says that last month marks the 38th consecutive January and the 347th consecutive month (almost 29 years) that global temperatures have been above the average for the 20th century. The last time the average temperature was below-average in January was in 1976 and the last time there was a below-average month was February 1985. Record keeping goes back to 1880.
NOAA says the combined global land and ocean surfaces for last month was 54.8°F (12.7°C), or 1.17°F (0.65°C) above the 20th century January average of 53.6°F (12.0°C):
"Most areas of the world experienced warmer-than-average monthly temperatures, with the most notable warmth across Alaska, western Canada, southern Greenland, south-central Russia, Mongolia, and northern China. Parts of southeastern Brazil and central and southern Africa experienced record warmth, contributing to the warmest January Southern Hemisphere land temperature departure on record at 2.03°F (1.13°C) above the 20th century average. Temperature departures were below the long-term average across the eastern half of the contiguous U.S, Mexico, and much of Russia. However, no regions of the globe were record cold."
The Weather Channel asks "in a warming world, how can it be so bitterly cold? Deke Arndt, a scientist at the National Climatic Data Center explains":
"We see more evidence that we will continue to have cold air outbreaks as the climate continues to warm. Cold air outbreaks, like the type we saw in January, over time, have become statistically more uncommon. Even though it was generally colder than average east of the Continental Divide and in parts of Siberia, it was warmer than average elsewhere. Take Alaska for example. The Last Frontier is normally frigid this time of year, but looking at the map it's clear that temperatures were well above average for January. January's average monthly high temperature for Fairbanks, Alaska is 1.1°F. But the average January high temperature in Fairbanks this year was nearly 15° higher than normal, at 16.4°F. At one point, the afternoon high temperature in Fairbanks hit 45°F, which was a tie for its sixth warmest January day on record."
Last edited:
")