luiza
Diamond Member
Much more important than you might well appreciate .
The Warming theory had to be abandoned as its stupidities were exposed.
Deep State / UN / IPPC rebranded the conspiracy as Climate Change .
Even more absurd, just on a common sense scientific basis -- almost all enery comes from the sun , not from us .
Now you will see the evil Deep Staters move to brand the imaginary Climate crisis as a Health Threat to mankind .
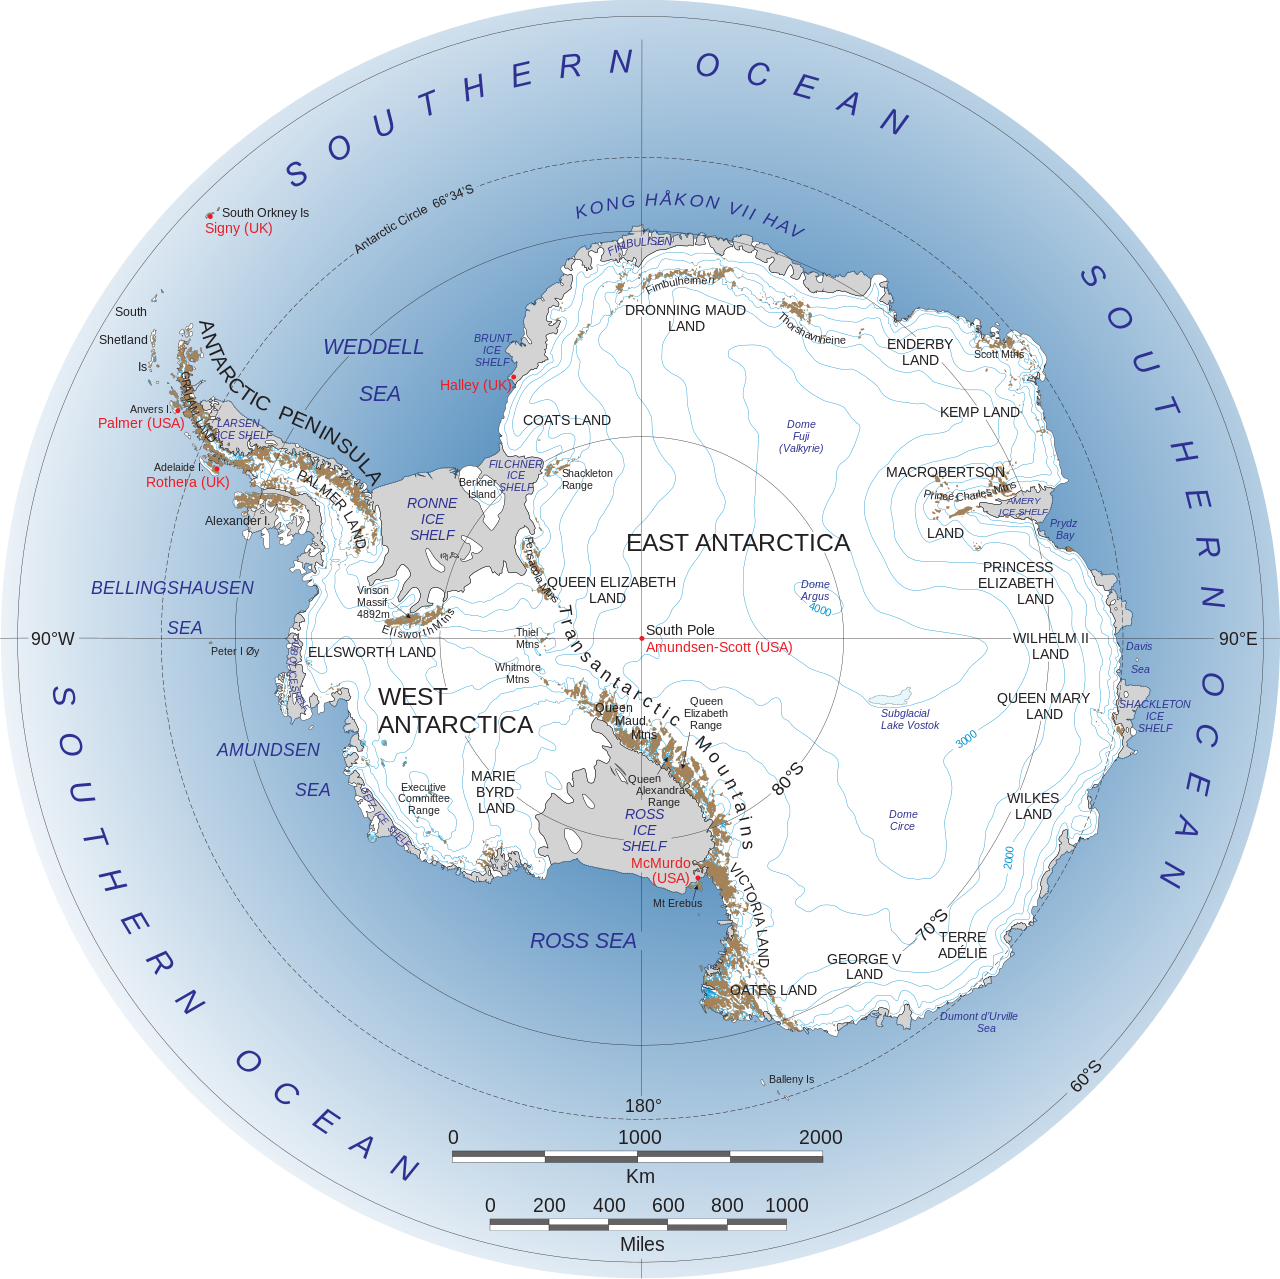
In a paper published by the American Meteorological Society, a group of international scientists note the “statistically significant” rate of temperature decline with the strongest cooling occurring in spring. During this season, the temperature fell by a massive 1.84°C every decade between 1999-2018. In the winter, the decadal fall was 1.19°C. The cooling was measured by a number of databases, while an accurate consistent record was collected from the Marie Byrd weather station.
Almost needless to say, none of this cooling was forecast by climate models. The authors suggest that models are an “important tool” in making future projections of future climate changes over Antarctica. But they admit that the models did not pick up the recent significant cooling in West Antarctica. There is said to be “no robust agreement” among the models on the important sea temperatures driving the western Antarctica air temperatures. Tropical Pacific climate oscillation is still an important source of uncertainty in future projections of West Antarctica air temperatures, it is observed.
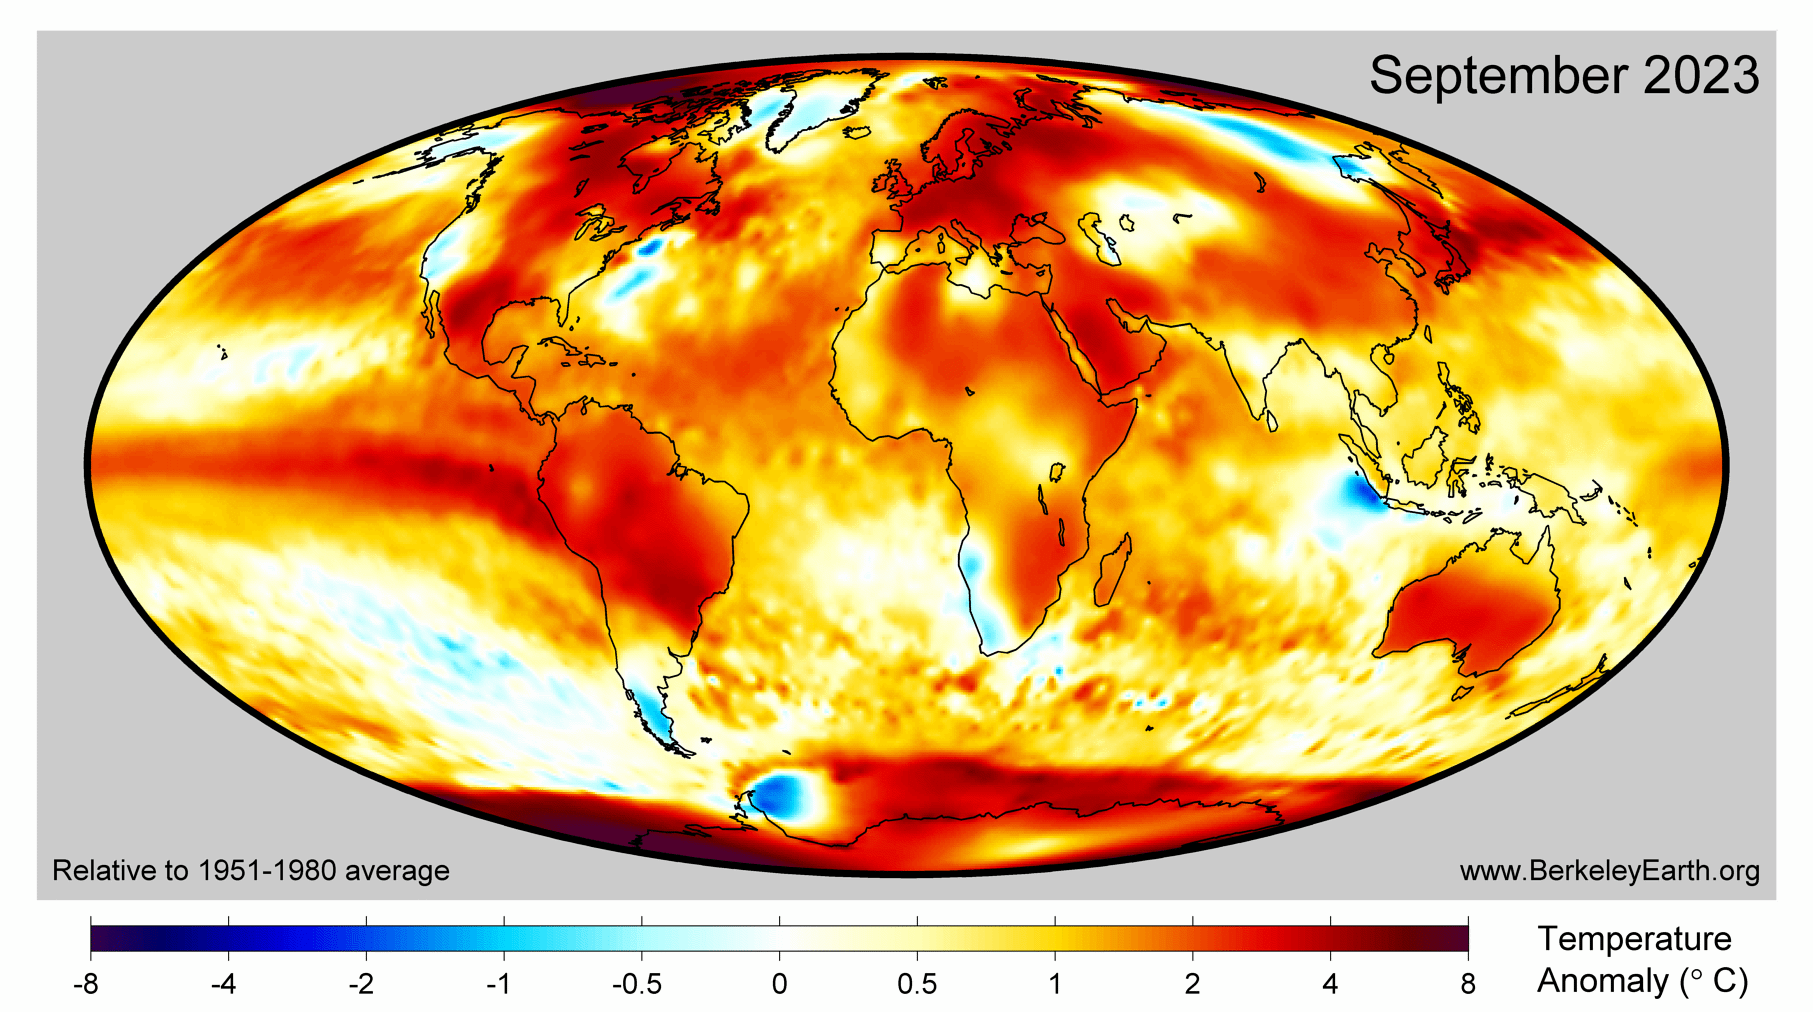
Was it ever thus? Forty years of hopelessly inaccurate temperature forecasts, along with unrealistic climate ‘tipping’ impacts driven by ridiculous suggestions that the temperature will rise by 4°C in less than 80 years, is hardly a record that inspires confidence. The recent appearance of clickbait attributions trying to pin individual weather events on human activities is little more than a scientific joke. These politicised attempts to measure the unmeasurable are a complete waste of time and money, the uncharitable might note. Not least because the models are corrupted by the notion promoted by the UN’s IPCC that all or most global warming since 1900 is caused by humans burning fossil fuel. This might seem an increasingly implausible suggestion in the light of much science including this latest paper on the recent dramatic drop in Antarctica temperatures.
Of course, the 2023 low sea ice story has moved on. In mainstream media it would be considered very bad form to note that according to the latest figures from the NSIDC, the start of summer in October saw below-trend ice melt – 903,000 square kilometres compared with the average of 985,000 sq kms. Up in the Arctic, pickings have been thin for some years following the small cyclical recovery in sea ice that set in around 2014. As the winter takes hold, the NSIDC reports that the ice has increased “at a faster than average pace”. The freeze is said to have been particularly rapid along the Siberian seas where the ice cover expanded to the coast by the end of last month. Things are not look good for Sir David Attenborough’s claim in last year’s Frozen Planet II that summer sea ice could all be gone in 12 years. Over at the Greenland ice sheet, the latest information from the Danish Polar Portal shows winter ice growing back faster than the 1981-2010 average.
Source
The Warming theory had to be abandoned as its stupidities were exposed.
Deep State / UN / IPPC rebranded the conspiracy as Climate Change .
Even more absurd, just on a common sense scientific basis -- almost all enery comes from the sun , not from us .
Now you will see the evil Deep Staters move to brand the imaginary Climate crisis as a Health Threat to mankind .
In a paper published by the American Meteorological Society, a group of international scientists note the “statistically significant” rate of temperature decline with the strongest cooling occurring in spring. During this season, the temperature fell by a massive 1.84°C every decade between 1999-2018. In the winter, the decadal fall was 1.19°C. The cooling was measured by a number of databases, while an accurate consistent record was collected from the Marie Byrd weather station.
Almost needless to say, none of this cooling was forecast by climate models. The authors suggest that models are an “important tool” in making future projections of future climate changes over Antarctica. But they admit that the models did not pick up the recent significant cooling in West Antarctica. There is said to be “no robust agreement” among the models on the important sea temperatures driving the western Antarctica air temperatures. Tropical Pacific climate oscillation is still an important source of uncertainty in future projections of West Antarctica air temperatures, it is observed.
Was it ever thus? Forty years of hopelessly inaccurate temperature forecasts, along with unrealistic climate ‘tipping’ impacts driven by ridiculous suggestions that the temperature will rise by 4°C in less than 80 years, is hardly a record that inspires confidence. The recent appearance of clickbait attributions trying to pin individual weather events on human activities is little more than a scientific joke. These politicised attempts to measure the unmeasurable are a complete waste of time and money, the uncharitable might note. Not least because the models are corrupted by the notion promoted by the UN’s IPCC that all or most global warming since 1900 is caused by humans burning fossil fuel. This might seem an increasingly implausible suggestion in the light of much science including this latest paper on the recent dramatic drop in Antarctica temperatures.
Of course, the 2023 low sea ice story has moved on. In mainstream media it would be considered very bad form to note that according to the latest figures from the NSIDC, the start of summer in October saw below-trend ice melt – 903,000 square kilometres compared with the average of 985,000 sq kms. Up in the Arctic, pickings have been thin for some years following the small cyclical recovery in sea ice that set in around 2014. As the winter takes hold, the NSIDC reports that the ice has increased “at a faster than average pace”. The freeze is said to have been particularly rapid along the Siberian seas where the ice cover expanded to the coast by the end of last month. Things are not look good for Sir David Attenborough’s claim in last year’s Frozen Planet II that summer sea ice could all be gone in 12 years. Over at the Greenland ice sheet, the latest information from the Danish Polar Portal shows winter ice growing back faster than the 1981-2010 average.
Source