protectionist
Diamond Member
- Oct 20, 2013
- 63,119
- 22,846
- 2,250
Restored isnt added. Ho hum.LOL
Your senility can't alter reality, gramps. 9½ million jobs added under Biden.


Follow along with the video below to see how to install our site as a web app on your home screen.
Note: This feature may not be available in some browsers.
Restored isnt added. Ho hum.LOL
Your senility can't alter reality, gramps. 9½ million jobs added under Biden.
Fool, it was, and I've been posting it for 4 years. Don't you know that the BEA routinely changes its charts ? (always to flatter a Democrat) I've told you that already too.
Forgot ?

Try this one on for size >>
Note: after you click the link, you have to click the little square in the upper left corner to set the years that you want to see (2015-2018)
United States GDP Annual Growth Rate
The Gross Domestic Product (GDP) in the United States expanded 2.70 percent in the first quarter of 2026 over the same quarter of the previous year. This page provides the latest reported value for - United States GDP Annual Growth Rate - plus previous releases, historical high and low...tradingeconomics.com
View attachment 663710
This chart just linked to right now, (almost identical to the V-GRAPH I've been posting) shows GDP going from 1.4 - 2 in 2016, with a link, and labeled.
Yours shows 1.9 - 2.4, with a stuck-on label, that looks as phony as a $3 bill.
As always, the 2015/2016 is a SINKING failure, with GDPs rising when Trump took over. Ho hum.
Which Obama had FOUR times in 2015 and 2016.
3.8-2.2........
3.0-1.9
2.2-1.7
1.9-1.4
Set dates for 2015-01 to 2016-09
View attachment 663712United States GDP Annual Growth Rate
The Gross Domestic Product (GDP) in the United States expanded 2.70 percent in the first quarter of 2026 over the same quarter of the previous year. This page provides the latest reported value for - United States GDP Annual Growth Rate - plus previous releases, historical high and low...

433 and 435 both have links. Going blind ?
I forgot the link for 437, but it's the same one as the other 2.

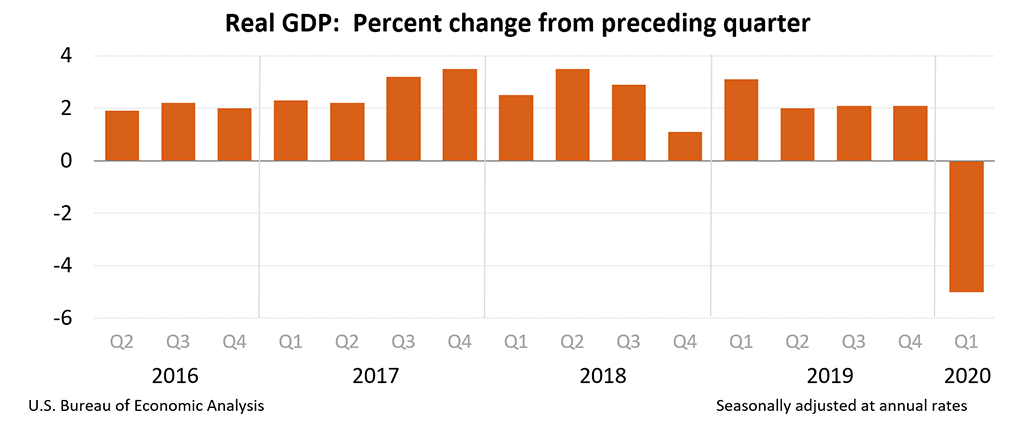
Dumbass what exactly do you think YOUR graph showed?This is nothing more than % changes from on quarter to another, Doesn't show squat about the good of the economy.
Dumbass what exactly do you think YOUR graph showed?
circles.
He's already demonstrated he has no ******* clue what he's talking about. If he's smart, he'll just abandon posting in this thread altogether.
But that abject imbecile was literally posting annual growth but referring to it as quarterly growth. That became obvious once he finally posted a link to his source, which he resisted posting, and for good reason, for quite some time.
it’s worth telling you if you didn’t know. It’s worth telling you if you assumed it was better under republicans without actually knowing the data.
Biden‘a job growth numbers are historic by themselves. 8.7 million jobs have been created under Biden so far. Now, while inflation certainly is a problem right now, pretending it is all that matters is fallacious and disingenuous. This is especially important because every other economic metric has been doing quite well under Biden. Hell even if a recession hits under Biden (which i admit is a possibility), it won’t change the fact that Republican job growth is shitty. Trump‘a job growth specifically was pitiful in comparison to Biden’s.

Jobs, Income, GDP Growth 'Startlingly' Higher Under Democratic Presidents
Democratic presidents are "more willing to heed historical lessons," but Republicans cling to "magical" tax cuts and deregulation theories during economic downturns, states a new economic analysis.www.newsweek.com

Biden hails 'historically strong growth' in May jobs report
The U.S. added a robust 390,000 jobs in Maywww.ny1.com
| POTUS | SEN | Con | UN-EMP Rate | POV Rate | Crime Rate | GDP | Ave. Misery Rate | Ave. MORT Rate | Infl. Rate | Fed. Debt |
| Ford | Dem | Dem | 8.48 | 12.3 | 5.30% | -0.21% | 15.10% | 9.05% | 9.14% | 533.2 B |
| Ford | Dem | Dem | 7.70 | 11.8 | 5.29% | 5.39% | 12.70% | 8.87% | 5.74% | 620.4 B |
| Carter | Dem | Dem | 7.05 | 11.6 | 5.08% | 4.62% | 13.10% | 8.85% | 6.50% | 699.8 B |
| Carter | Dem | Dem | 6.07 | 11.4 | 5.14% | 5.54% | 15.00% | 9.64% | 7.63% | 771.5 B |
| Carter | Dem | Dem | 5.85 | 11.7 | 5.57% | 3.17% | 19.30% | 11.20% | 11.25% | 826.5 B |
| Carter | Dem | Dem | 7.18 | 13 | 5.95% | -0.26% | 19.70% | 13.74% | 13.55% | 907.7 B |
| Reagan | Rep | Dem | 7.62 | 14 | 5.86% | 2.54% | 12.19% | 16.63% | 10.33% | 997.9 B |
| Reagan | Rep | Dem | 9.71 | 15 | 5.60% | -1.80% | 12.19% | 16.04% | 6.13% | 1.14 T |
| Reagan | Rep | Dem | 9.60 | 15.2 | 5.18% | 4.58% | 12.19% | 13.24% | 3.21% | 1.38 T |
| Reagan | Rep | Dem | 7.51 | 14.4 | 5.03% | 7.24% | 12.19% | 13.88% | 4.30% | 1.57 T |
| Reagan | Rep | Dem | 7.19 | 14 | 5.21% | 4.17% | 12.19% | 12.43% | 3.55% | 1.82 T |
| Reagan | Rep | Dem | 7.00 | 13.6 | 5.50% | 3.46% | 12.19% | 10.19% | 1.90% | 2.13 T |
| Reagan | Dem | Dem | 6.18 | 13.4 | 5.58% | 3.46% | 12.19% | 10.21% | 3.66% | 2.35 T |
| Reagan | Dem | Dem | 5.49 | 13 | 5.66% | 4.18% | 12.19% | 10.34% | 4.08% | 2.60 T |
| Bush | Dem | Dem | 5.26 | 12.8 | 5.74% | 3.68% | 10.68% | 10.32% | 4.83% | 2.86 T |
| Bush | Dem | Dem | 5.62 | 13.5 | 5.82% | -1.79% | 10.68% | 10.13% | 5.40% | 3.23 T |
| Bush | Dem | Dem | 6.85 | 14.2 | 5.90% | -1.99% | 10.68% | 9.25% | 4.24% | 3.67 T |
| Bush | Dem | Dem | 7.49 | 14.8 | 5.66% | 3.52% | 10.68% | 8.39% | 3.03% | 4.06 T |
| Clinton | Dem | Dem | 6.91 | 15.1 | 5.48% | 2.75% | 9.20% | 7.31% | 2.95% | 4.41 T |
| Clinton | Dem | Dem | 6.10 | 14.5 | 5.37% | 4.03% | 8.20% | 8.38% | 2.61% | 4.70 T |
| Clinton | Rep | Rep | 5.59 | 13.8 | 5.28% | 2.68% | 8.10% | 7.93% | 2.81% | 4.98 T |
| Clinton | Rep | Rep | 5.41 | 13.7 | 5.09% | 3.77% | 8.70% | 7.81% | 2.93% | 5.22 T |
| Clinton | Rep | Rep | 4.94 | 13.3 | 4.93% | 4.45% | 6.40% | 7.60% | 2.34% | 5.41 T |
| Clinton | Rep | Rep | 4.50 | 12.7 | 4.62% | 4.48% | 6.00% | 6.94% | 1.55% | 5.53 T |
| Clinton | Rep | Rep | 4.22 | 11.9 | 4.27% | 4.75% | 6.70% | 7.44% | 2.19% | 5.66 T |
| Clinton | Rep | Rep | 3.97 | 11.3 | 4.12% | -0.63% | 7.30% | 8.05% | 3.38% | 5.67 T |
| Bush | Dem | Rep | 4.74 | 11.7 | 4.16% | -3.13% | 7.30% | 6.97% | 2.83% | 5.80 T |
| Bush | Dem | Rep | 5.78 | 12.1 | 4.13% | 1.74% | 8.40% | 6.54% | 1.59% | 6.23 T |
| Bush | Rep | Rep | 5.99 | 12.5 | 4.07% | 2.86% | 7.60% | 5.83% | 2.27% | 6.78 T |
| Bush | Rep | Rep | 5.54 | 12.7 | 3.98% | 3.80% | 8.70% | 5.84% | 2.68% | 7.38 T |
| Bush | Rep | Rep | 5.08 | 12.6 | 3.90% | 3.51% | 8.30% | 5.87% | 3.39% | 7.93 T |
| Bush | Rep | Rep | 4.61 | 12.3 | 3.81% | 2.86% | 6.90% | 6.41% | 3.23% | 8.50 T |
| Bush | Dem | Dem | 4.62 | 12.5 | 3.73% | 1.88% | 9.10% | 6.34% | 2.85% | 9.07 T |
| Bush | Dem | Dem | 5.80 | 13.2 | 3.67% | -0.14% | 7.40% | 6.03% | 3.84% | 10.02 T |
| Obama | Dem | Dem | 9.28 | 14.3 | 3.51% | -2.54% | 12.60% | 5.04% | -0.36% | 11.90 T |
| Obama | Dem | Dem | 9.61 | 15.1 | 3.35% | 2.56% | 10.80% | 4.69% | 1.64% | 13.56 T |
| Obama | Dem | Rep | 8.93 | 15 | 3.29% | 1.55% | 11.50% | 4.45% | 3.16% | 14.79 T |
| Obama | Dem | Rep | 8.08 | 15 | 3.26% | 2.25% | 9.60% | 3.66% | 2.07% | 16.06 T |
| Obama | Dem | Rep | 7.36 | 14.8 | 3.11% | 1.84% | 8.20% | 3.98% | 1.46% | 16.74 T |
| Obama | Dem | Rep | 6.16 | 14.8 | 2.95% | 2.53% | 6.40% | 4.17% | 1.62% | 17.82 T |
| Obama | Rep | Rep | 5.28 | 13.5 | 2.89% | 2.91% | 5.70% | 3.85% | 0.12% | 18.15 T |
| Obama | Rep | Rep | 4.88 | 12.7 | 2.85% | 1.64% | 6.80% | 3.65% | 1.26% | 19.57 T |
| Trump | Rep | Rep | 4.35 | 12.3 | 2.76% | 2.37% | 6.30% | 3.99% | 2.13% | 20.24 T |
| Trump | Rep | Rep | 3.89 | 11.8 | 2.59% | 2.93% | 5.80% | 4.54% | 2.44% | 21.52 T |
| Trump | Rep | Dem | 3.68 | 10.5 | 2.49% | 2.16% | 5.80% | 3.94% | 1.81% | 22.71 T |
| Trump | Rep | Dem | 9.3 | -31.20% | 6.6 | 3.16% | 1.25% | |||
| Trump | Rep | Dem | 6.70 | 11.7 | 4.70% | Year -3.3% | 6.6 | 3.11% | 1.25% | 26.95 T |
| Xiden | Dem | Dem | 3.90 | Pend. | Pend. | 5.70% | 10.94 | 3.67% | 7.00% | 30T |
| Xiden | Dem | Dem | 3.60 | Pend. | Pend. | -1.50% | 12.18 | 6.26% | 8.60% | 30.5T |
Lol I love how you post this and claim “it’s the opposite” when it clearly isn’t. What is this source anyway? Does it cover job growth and wage growth? All that is better under democrats as well.ILMAO..........It's the opposite. Check out the data, Billy doesn't know what he's talking about. When does he? Billy's consistent:
POTUS SEN Con UN-EMP
RatePOV
RateCrime
RateGDP Ave.
Misery RateAve.
MORT
RateInfl.
RateFed.
DebtFord Dem Dem 8.48 12.3 5.30% -0.21% 15.10% 9.05% 9.14% 533.2 B Ford Dem Dem 7.70 11.8 5.29% 5.39% 12.70% 8.87% 5.74% 620.4 B Carter Dem Dem 7.05 11.6 5.08% 4.62% 13.10% 8.85% 6.50% 699.8 B Carter Dem Dem 6.07 11.4 5.14% 5.54% 15.00% 9.64% 7.63% 771.5 B Carter Dem Dem 5.85 11.7 5.57% 3.17% 19.30% 11.20% 11.25% 826.5 B Carter Dem Dem 7.18 13 5.95% -0.26% 19.70% 13.74% 13.55% 907.7 B Reagan Rep Dem 7.62 14 5.86% 2.54% 12.19% 16.63% 10.33% 997.9 B Reagan Rep Dem 9.71 15 5.60% -1.80% 12.19% 16.04% 6.13% 1.14 T Reagan Rep Dem 9.60 15.2 5.18% 4.58% 12.19% 13.24% 3.21% 1.38 T Reagan Rep Dem 7.51 14.4 5.03% 7.24% 12.19% 13.88% 4.30% 1.57 T Reagan Rep Dem 7.19 14 5.21% 4.17% 12.19% 12.43% 3.55% 1.82 T Reagan Rep Dem 7.00 13.6 5.50% 3.46% 12.19% 10.19% 1.90% 2.13 T Reagan Dem Dem 6.18 13.4 5.58% 3.46% 12.19% 10.21% 3.66% 2.35 T Reagan Dem Dem 5.49 13 5.66% 4.18% 12.19% 10.34% 4.08% 2.60 T Bush Dem Dem 5.26 12.8 5.74% 3.68% 10.68% 10.32% 4.83% 2.86 T Bush Dem Dem 5.62 13.5 5.82% -1.79% 10.68% 10.13% 5.40% 3.23 T Bush Dem Dem 6.85 14.2 5.90% -1.99% 10.68% 9.25% 4.24% 3.67 T Bush Dem Dem 7.49 14.8 5.66% 3.52% 10.68% 8.39% 3.03% 4.06 T Clinton Dem Dem 6.91 15.1 5.48% 2.75% 9.20% 7.31% 2.95% 4.41 T Clinton Dem Dem 6.10 14.5 5.37% 4.03% 8.20% 8.38% 2.61% 4.70 T Clinton Rep Rep 5.59 13.8 5.28% 2.68% 8.10% 7.93% 2.81% 4.98 T Clinton Rep Rep 5.41 13.7 5.09% 3.77% 8.70% 7.81% 2.93% 5.22 T Clinton Rep Rep 4.94 13.3 4.93% 4.45% 6.40% 7.60% 2.34% 5.41 T Clinton Rep Rep 4.50 12.7 4.62% 4.48% 6.00% 6.94% 1.55% 5.53 T Clinton Rep Rep 4.22 11.9 4.27% 4.75% 6.70% 7.44% 2.19% 5.66 T Clinton Rep Rep 3.97 11.3 4.12% -0.63% 7.30% 8.05% 3.38% 5.67 T Bush Dem Rep 4.74 11.7 4.16% -3.13% 7.30% 6.97% 2.83% 5.80 T Bush Dem Rep 5.78 12.1 4.13% 1.74% 8.40% 6.54% 1.59% 6.23 T Bush Rep Rep 5.99 12.5 4.07% 2.86% 7.60% 5.83% 2.27% 6.78 T Bush Rep Rep 5.54 12.7 3.98% 3.80% 8.70% 5.84% 2.68% 7.38 T Bush Rep Rep 5.08 12.6 3.90% 3.51% 8.30% 5.87% 3.39% 7.93 T Bush Rep Rep 4.61 12.3 3.81% 2.86% 6.90% 6.41% 3.23% 8.50 T Bush Dem Dem 4.62 12.5 3.73% 1.88% 9.10% 6.34% 2.85% 9.07 T Bush Dem Dem 5.80 13.2 3.67% -0.14% 7.40% 6.03% 3.84% 10.02 T Obama Dem Dem 9.28 14.3 3.51% -2.54% 12.60% 5.04% -0.36% 11.90 T Obama Dem Dem 9.61 15.1 3.35% 2.56% 10.80% 4.69% 1.64% 13.56 T Obama Dem Rep 8.93 15 3.29% 1.55% 11.50% 4.45% 3.16% 14.79 T Obama Dem Rep 8.08 15 3.26% 2.25% 9.60% 3.66% 2.07% 16.06 T Obama Dem Rep 7.36 14.8 3.11% 1.84% 8.20% 3.98% 1.46% 16.74 T Obama Dem Rep 6.16 14.8 2.95% 2.53% 6.40% 4.17% 1.62% 17.82 T Obama Rep Rep 5.28 13.5 2.89% 2.91% 5.70% 3.85% 0.12% 18.15 T Obama Rep Rep 4.88 12.7 2.85% 1.64% 6.80% 3.65% 1.26% 19.57 T Trump Rep Rep 4.35 12.3 2.76% 2.37% 6.30% 3.99% 2.13% 20.24 T Trump Rep Rep 3.89 11.8 2.59% 2.93% 5.80% 4.54% 2.44% 21.52 T Trump Rep Dem 3.68 10.5 2.49% 2.16% 5.80% 3.94% 1.81% 22.71 T Trump Rep Dem 9.3 -31.20% 6.6 3.16% 1.25% Trump Rep Dem 6.70 11.7 4.70% Year
-3.3%6.6 3.11% 1.25% 26.95 T Xiden Dem Dem 3.90 Pend. Pend. 5.70% 10.94 3.67% 7.00% 30T Xiden Dem Dem 3.60 Pend. Pend. -1.50% 12.18 6.26% 8.60% 30.5T
It showed the Gross Domestic Production of the country quarterly for 4 years, with Obama's GDPs SINKING like a rock, and Trump's GDPs consistently bringing them back up again, from Obama's low levels. Only trouble is, it doesn't get shown on liberal TV shows, and liberals like Billy000 remain ignorant, even while conservatives having watched conservative TV shows, have known it for years.Dumbass what exactly do you think YOUR graph showed?
Biden has made us the laughing stock of the world poor old senile turdLol I love how you present this long list when all of those things are related to the same issue. Trust me I noticed. Your facade was a weak attempt. Oh and just you know, inflation is high all over the world.
I mean either way dude you might as well vote democrat. Republicans fail you.
The word "data"as become a JOKE in America. Talking heads on TV keep saying the inflation rate (which they get from govt "data") is 8.6%. While this is very high compared to the 1.4% rate when Trump left office. 8.6% is nothing compared to the 100-200% inflation that has occured in the rental housing industry, which does not get anywhere near as much mention as gas & food prices.You’re welcome to find your own data to counter mine if you think it’s wrong lol
It showed the Gross Domestic Production of the country quarterly for 4 years, with Obama's GDPs SINKING like a rock, and Trump's GDPs consistently bringing them back up again, from Obama's low levels. Only trouble is, it doesn't get shown on liberal TV shows, and liberals like Billy000 remain ignorant, even while conservatives having watched conservative TV shows, have known it for years.
And then another liberal like you comes in here and presents a rather meaningless, irrelevant graph that does nothing but show changes from one quarter to another, and everybody sits here and says "Yeah, so ?"
Thats like having somebody talk about the batting averages of baseball's greatest hitter, Ted Williams, and say well in 3 different years he hit .406, .375, and .388. So the averages changed from one year to another. OK. So what about it ?
You are the "Dumbass" for posting a chart unrelated to the discussion.
The word "data"as become a JOKE in America. Talking heads on TV keep saying the inflation rate (which they get from govt "data") is 8.6%. While this is very high compared to the 1.4% rate when Trump left office. 8.6% is nothing compared to the 100-200% inflation that has occured in the rental housing industry, which does not get anywhere near as much mention as gas & food prices.
"data" ? The data is in my (and 1000s of others) checking account, which shows a 43% increase in rent, which would have been 100% if I had stayed where I was, and not moved (which cost a lot of money and trouble) a few months ago.
The "data" also doesnt show the 118% increase in rent if I would have stayed where I was, in the apartment I moved out of last year - rent went from $550/mo to $1200/mo
Nor does it show the 200% increases in apartments going (routinely) from $600/mo to $1800/mo, and from $700/mo to over $2000/mo.
So what is the new rent standard that landlords are charging for what people HAVE TO HAVE TO SURVIVE ? >> Answer: Anything.
View attachment 664202
agreed…obamacare isn’t commie. The dems aren’t commie l…they aren’t even socialist…they are fascist. Obamacare is a fascist policy. The demafasict partner with some big business, and support them, so long as the business does the bidding of the partyNot even close.
agreed…obamacare isn’t commie. The dems aren’t commie l…they aren’t even socialist…they are fascist. Obamacare is a fascist policy. The demafasict partner with some big business, and support them, so long as the business does the bidding of the party
pretty sure i explained.....how is Obamacare...fascist?
Were you dropped on your head?
pretty sure i explained
do you not know what fascism is? again i explained in the post you quoted