Grand Solar Minimum.... And Cooling....

You claim that the initial discovery was an actual measurement of CMB...it wasn't...CMB was discovered via a resonant radio frequency.
Pathological liar.

Alas you are the one with a pathological need to alter everything you read to mean what you need it to mean without regard to what the words actually say. I spend as much time correcting your misrepresntations of what I have said as I do actually answering your comments
Now you are implying all physicists over the past hundred years or so are pathologically altering everything. Yep. You can (mis)read the words, but you don't understand them.
You are aware that every EM transmission causes second, third, fourth and 5th value reflections, aren't you? The ripple effect causes what is known as a shadow or negative wave.These are at harmonic step decreases due to the wave reflections colliding. This is CMB.

The radio transmitter identified the energy because of its harmonic wave at a much lower resonating frequency. The confused scientists then looked for the source, which took them years to isolate.
 
The Earth is trending towards zero anomaly... As the sun wains the earth cools...

Cooling trend now going on four years..

Dec2018-UAH-compare-Feb2016-720x415.png


UAH Global Temperature Update for December 2018: +0.25 deg. C « Roy Spencer, PhD
 
Last edited:
No, that data do not show a cooling trend. They show a warming trend; unless you actually expect us all to accept the most blatant of cherry-picking. "Look all of you, as winter came on it got colder".
 
No, that data do not show a cooling trend. They show a warming trend; unless you actually expect us all to accept the most blatant of cherry-picking. "Look all of you, as winter came on it got colder".

Cherry picking? Like showing arctic ice from only the 70's...and all the other short views you wack jobs present rather than showing the bigger picture...take that graph back a thousand years..and tell me what it shows...

by the way idiot...look at the bottom of the graph...those numbers...they are years...do you think it has been winter since 2016?
 
You think that data show a cooling trend?


You don't? Never mind...I almost forgot that you can't read a graph..

That graph display the warming trend the Earth has been experiencing since long before that satellite data began. If you really want to suggest that the Earth has NOT been getting warmer since the beginning of the industrial revolution, I suggest you see if the Flat Earth Society (www.theFlatEarthSociety.org) could share meeting space with you. You have a problem with the OBSERVATIONS that clearly say otherwise.

Actually, the earth has been getting warmer since the end of the little ice age...it is to be expected....
 
View attachment 223935

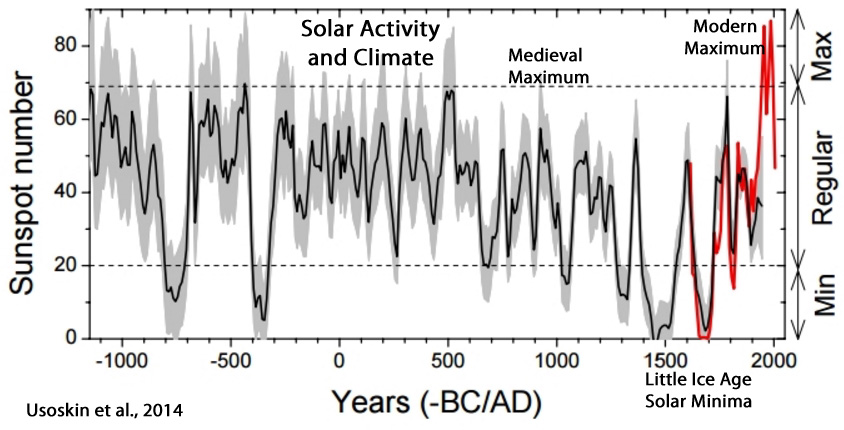
Now lets look closer.. The sun has cycles(red lined grand minimums) initially faster (800-900 years) then elongating (out to 1200 years) then a pause before a Grand minimum where massive cooling occurs. The pause warming is liner and sloped. We have reached that slope maximum and now were headed to cooling. Given the cycle progression we should expect 1-1.5 deg C drop in global temperatures over the next 60-90 years..

People refuse to look at the historical "writing on the wall" but the pattern is clear..

Holy shit! Look at that!
Summabitch! It's been there an along!

Good one!
Jo
 
Unfortunatetly, your graph is temperatures on Earth, not solar activity.


Modern-Grand-Maximum-Usoskin-2014.jpg


Feel free to try to line those up.
 
Unfortunatetly, your graph is temperatures on Earth, not solar activity.


Modern-Grand-Maximum-Usoskin-2014.jpg


Feel free to try to line those up.
Too Funny Mann and Crick,, Tacking on 10 year plots to the end of 1000 year plots.. to make it look scary... Why don't you get the author of that graph to show you where the breaks and changes of scale are located? He's been called out for it by several real scientists.. SO why wont he correct it?
 
You failed to address the real comment. There is essentially zero correlation between actual TSI and the temperature pulses you are claiming they cause.

PS, let us see a link to a criticism of the way Usoskin appended modern observations (which start in 1600, not ten years ago) onto reconstructed data
 
Last edited:
You failed to address the real comment. There is essentially zero correlation between actual TSI and the temperature pulses you are claiming they cause.

PS, let us see a link to a criticism of the way Usoskin appended modern observations (which start in 1600, not ten years ago) onto reconstructed data
LOL

What a pile of crap...

solar compariosn 4 to 24.JPG


You want to tell me what happened to temp during this time? Or shall I go on and prove you a liar?
 
Lets play COOLING Russian roulette:

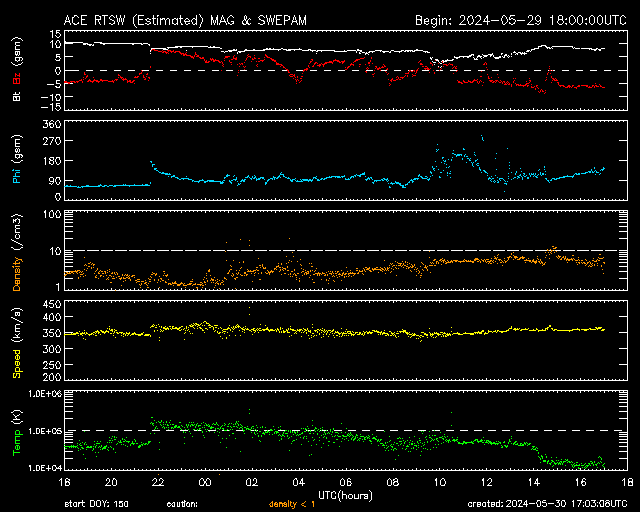
Solar Physicists from NASA are now showing a significant change in solar output in the bands emitted from the sun which penetrate earths oceans and cause warming. A Drop of 2.2w/m^2 has been detected over the last two years in the 0.2-1.3um wavelengths.

This shift is blamed on the changing Solar magnetic fields which is also believed to be causing the solar shut down and decrease in TSI (Total Solar IR-radiance). While TSI has only dropped 0.3w/m^2 the shift from the bands which warm the oceans to bands that have little effect on the oceans is worrying scientists. Our oceans regulate the temperature on earth and the loss of energy into them will cause cooling of the planet.

The question is, How long will this band shift remain? Some of us believe that this, along with position of our earth in its elliptical orbit all play a roll in glaciation. Oceanic Plant life reconstructions indicate that this shift happens at each glacial cycle....

Are our AGW friends pulling the trigger on killing millions with their baseless claims? I guess we will soon find out..

Solar Irradiance
 
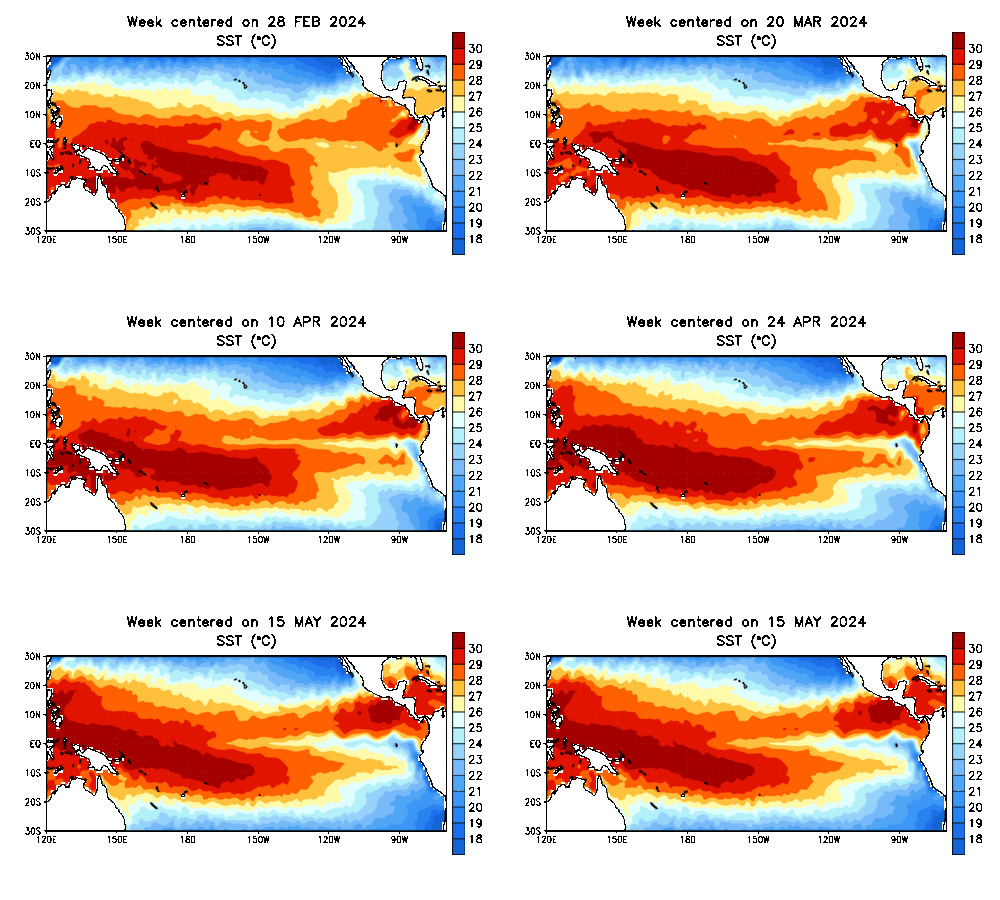
Say goodbye to MODOKI (or weak El Niño) ... When numbers are updated on Sunday it will be gone..

nino3_4.png


sstanim.gif


Input into the oceans is decreasing and the ocean is responding in buffered fashion...
 
Last edited:
View attachment 223935

Now lets look closer.. The sun has cycles(red lined grand minimums) initially faster (800-900 years) then elongating (out to 1200 years) then a pause before a Grand minimum where massive cooling occurs. The pause warming is liner and sloped. We have reached that slope maximum and now were headed to cooling. Given the cycle progression we should expect 1-1.5 deg C drop in global temperatures over the next 60-90 years..

People refuse to look at the historical "writing on the wall" but the pattern is clear..
Four months since the first post and not one post in this entire thread discredits the observations in the OP or post 2...

The AGW drones time is very short... The cooling has begun and the cycle will not be swayed from its time line...
 
Four months since the first post and not one post in this entire thread discredits the observations in the OP or post 2...

Don't lie. We pointed out the dishonesty of your cherrypicking scam. You had no response.

Temperature was well correlated with TSI up until about 1970, when it started going to opposite way. That's just when greenhouse gases started becoming really significant.

So, the hard data supports our theory, and debunks yours. Same old same old.

The AGW drones time is very short... The cooling has begun and the cycle will n[Qot be swayed from its time line...

Your Ice Age Cult has been saying the same thing constantly for over 40 years now, yet your HolyIceAge never gets here. No matter. Your faith is undimmed. Each time your predicted IcyArmageddon fails to arrive, you simply push the date of the EndOfTheWorld back some more, just like any other end-times cult does.
Just like your "were all gonna burn up" bullshit .... Ice ages are predictable and cyclical. Your BS warming is not....

Isn't life grand!
 

Forum List

Back
Top