Hoosier4Liberty
Libertarian Republican
- Oct 14, 2013
- 465
- 87
- 78
Hello fellow USMBers.
I did some analysis of the US Senate race using some handy Excel spreadsheets.
Using the following rankings, based off of Sabato Crystal Ball and polling data:
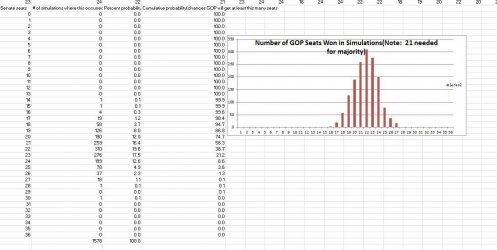
Long story short, I have cumulative probabilities on one of the files of the % chance the GOP can get so many seats. It shows the chances are 58% that the GOP will get at least 21 seats, which is +6 from what have now in that class, enough to take back the Senate.
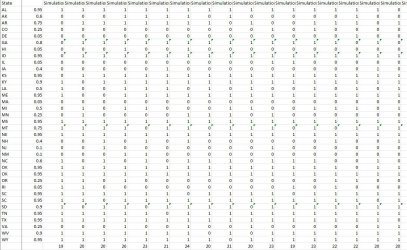
EDIT: The first attachment should be self-explanatory. In the 2nd attachment, I'm showing the raw data. I ran about 1500 simulations using Excel's random function of how the election would go. I have probabilities of the GOP winning each seat presented as decimals in the column after the name of the state. After that, each column is one of the simulations. I aggregated the results of the simulations and performed analyses on them in the 1st spreadsheet.
I did some analysis of the US Senate race using some handy Excel spreadsheets.
Using the following rankings, based off of Sabato Crystal Ball and polling data:
Long story short, I have cumulative probabilities on one of the files of the % chance the GOP can get so many seats. It shows the chances are 58% that the GOP will get at least 21 seats, which is +6 from what have now in that class, enough to take back the Senate.
EDIT: The first attachment should be self-explanatory. In the 2nd attachment, I'm showing the raw data. I ran about 1500 simulations using Excel's random function of how the election would go. I have probabilities of the GOP winning each seat presented as decimals in the column after the name of the state. After that, each column is one of the simulations. I aggregated the results of the simulations and performed analyses on them in the 1st spreadsheet.
Attachments
Last edited:

