Polar, why a graph that stops at 2011?
Tripling down on the Karl Et AL garbage tonight...? Love the correlation by graph sizing... Fits you and your lies really well...
Yeah, he asks the stupid question why I chose that graph. But he won`t ask why NASA made it to begin with.
Libtards feel free to pick one exception to what somebody else says and apply it as a rule/&or "established" fact to the whole thing. No matter what it is.
Unless it is a fact that does not fit their agenda. In that case no exception is allowable and if none can be found then it`s on to character assassination and smear campaigns.
There are enough of these AGW CO2/T garbage graphs that don`t match to fill a library but no matter which one you pick they will call it "cherry picking" as if there were only a few such "cherries" and not dump-truck loads of it. And there will be even more because these fact fakers keep "correcting" the temperature base line, lowering it in order to get an ever steeper ΔT for more recent data. But that kills the CO2/T correlation for the "corrected" base line. Unless they let all these graphs disappear where that happened there will be no shortage of cherries. Something that is off by a whooping factor of 2x is a pretty juicy cherry and they get really hostile if you confront them with one of these.
The other CO2 freak which posted that youtube cartoon was as freaked out by it just like the author of this garbage intended. A flat earth disc turns intensely red filling out the whole screen. No matter that the data it was based on did not match up with many of the other NASA graphs published for the same time period.
And that does not even touch on the fact that
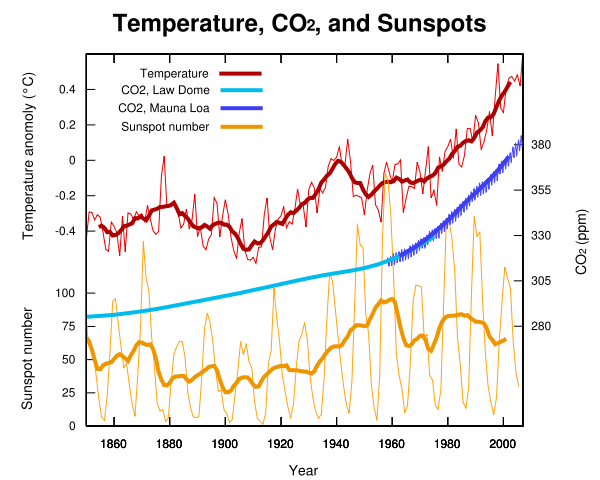
ALL of these graphs are deliberately misleading using a
massive scale expansion for the Y-axis to the point where a "normal pre-warming" temperature would be so far up the Y-axis that you would have to scroll your screen all day to get to it.
All these graphs are not showing actual temperature but just the "anomalies" the reason being that you don`t have to show a zero Y base line but get to blow a fraction of a Y increment all out of proportion.


")


