SSDD
Gold Member
- Nov 6, 2012
- 16,672
- 1,966
- 280
here... more info.... it isn’t as if there were a shortage of it out there if one is intereste.Of course he isn't...but that doesn't stop him from claiming to be one
Okay ... you win this one ... my apologies ...
My bet is that the emission along the seaboard has a great deal to do with the amount of nearly unbroken concrete to be found there.
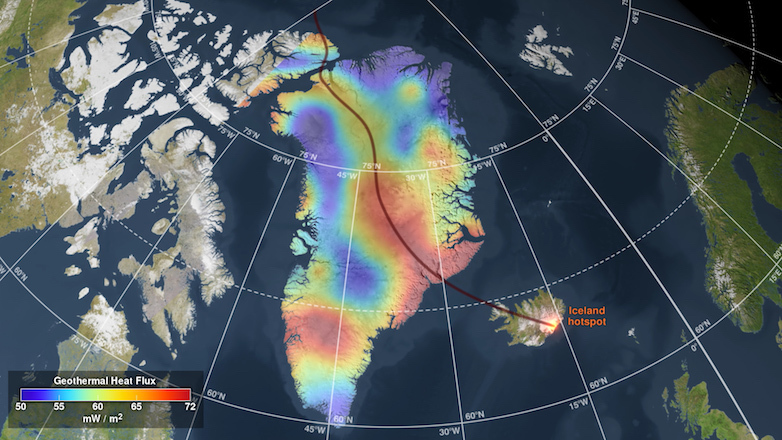
In any event...the idea of geothermal energy driving the climate along with the sun makes far more sense than something as ridiculous as a trace "cooling" gas in the atmosphere driving the climate.
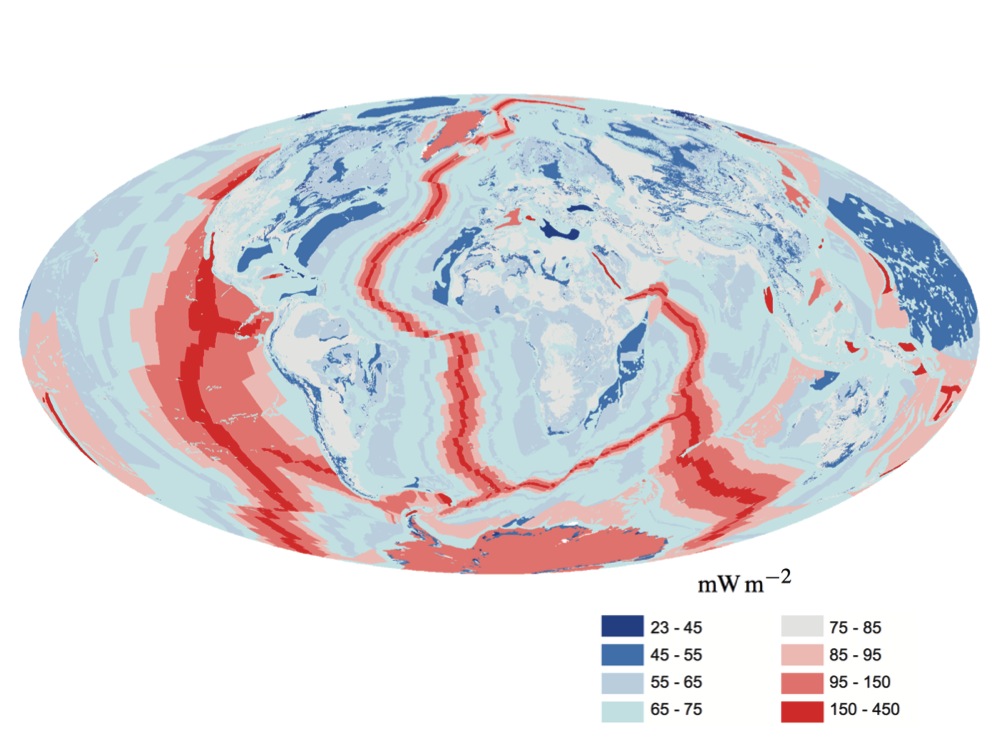
No ... the graphic shows three times as much energy leaving the surface as what can be attributed to the Sun ... cite please ...
I'm sorry ... a tiny temperature increase can be caused by a tiny amount of extra GHG ... how much we don't know, the thermometers we're using aren't accurate enough to tell ... we need to wait 100 years for that ...
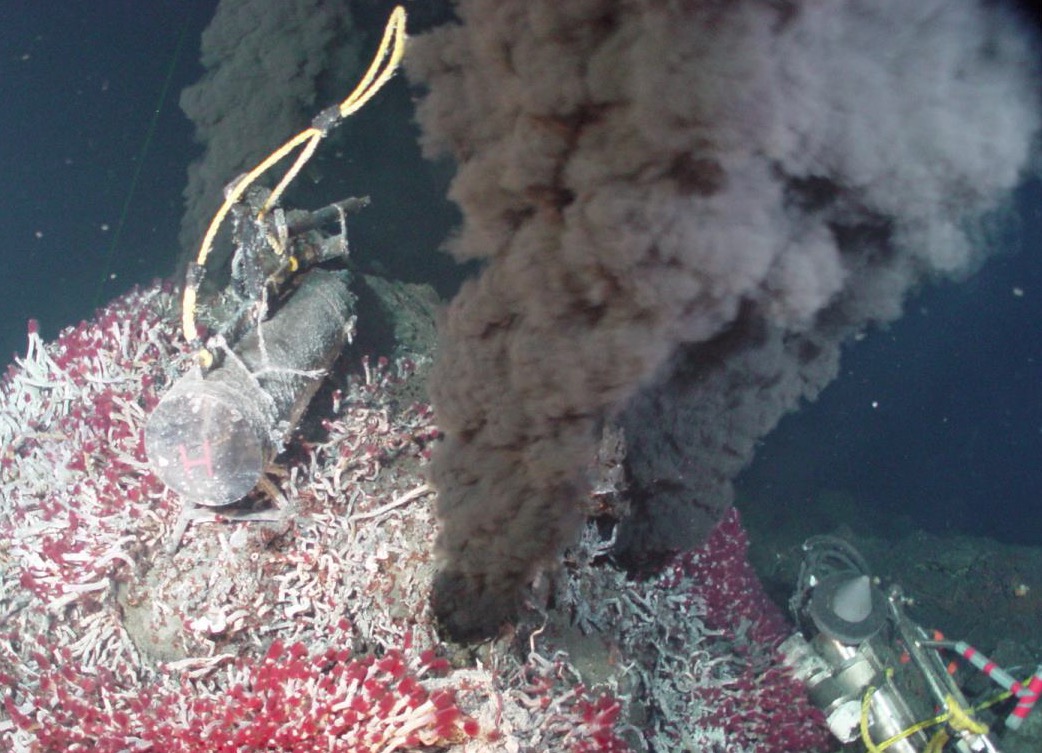
Geologic Heat Linked To East Coast Ocean Warming Trend
An ocean warming trend off the East Coast is likely from super-heated hydrothermal vents.
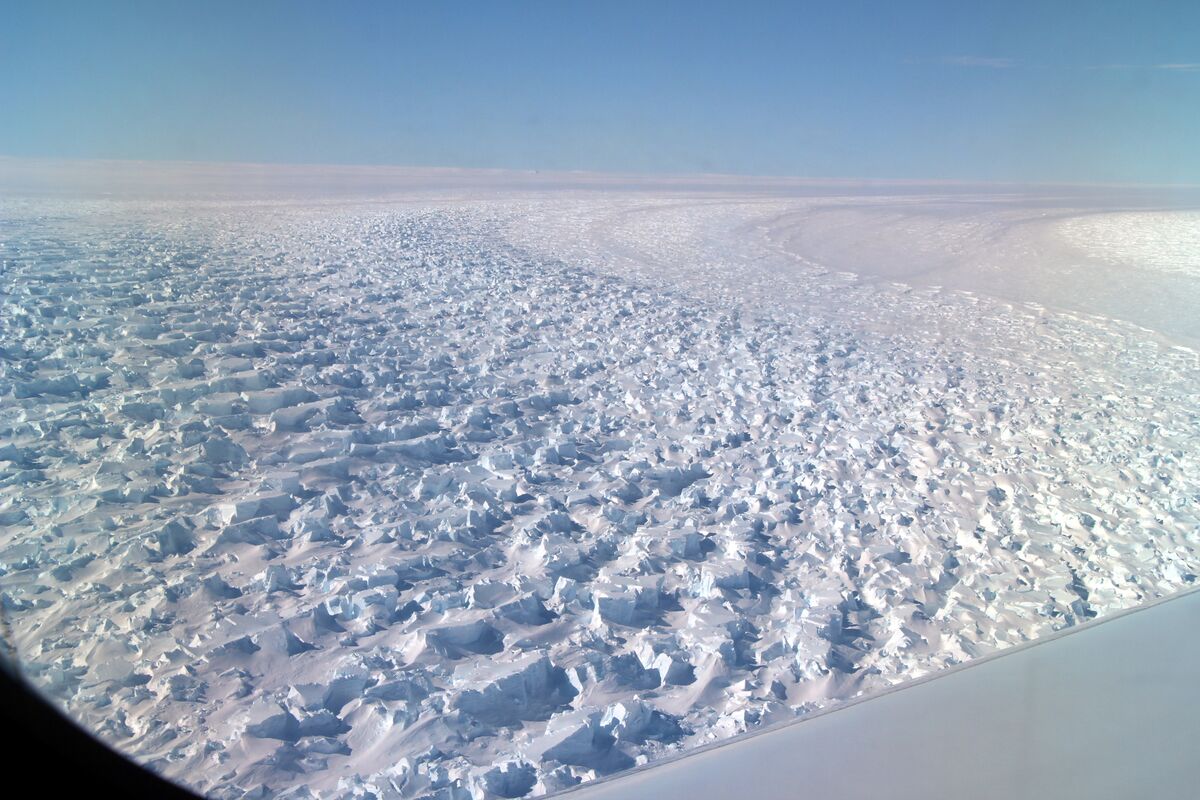
Look familiar?
The top image is from 2020...the bottom image is from 1979
Last edited: