You fools have been predicting cooling since the 1970s, yet we have gone 100 years without a cooling cycle. We have warming, then flat, then warming, then flat, then warming. Each new warming cycle begins about where the previous warming cycle left off.
You mean the SCIENTISTS along with the media back in the 1960's and 70's were predicting cooling, which really did happen from the 1940's to the 1970's.
You claim is patently false as HadCRut temperature doesn't see it that way
From
Dr. Jones BBC Interview showing warming and
COOLING phases since the mid 1800's, the chart up to 2009 using HIS data:
View attachment 192908
All warming trends similar and well below the AGW mandated Per Decade trend of at least .30C
Notice how the dishonest Right have to change what I said and create a Straw Man to argue against!!!
I said no cooling cycle for the last 100 years and to the Right 100 years ago was 1850.

Now your OWN chart shows warming, flat, warming over the last 100 years, so thank you for proving me correct.
BTW, your chart clearly was not made by the MetOffice.
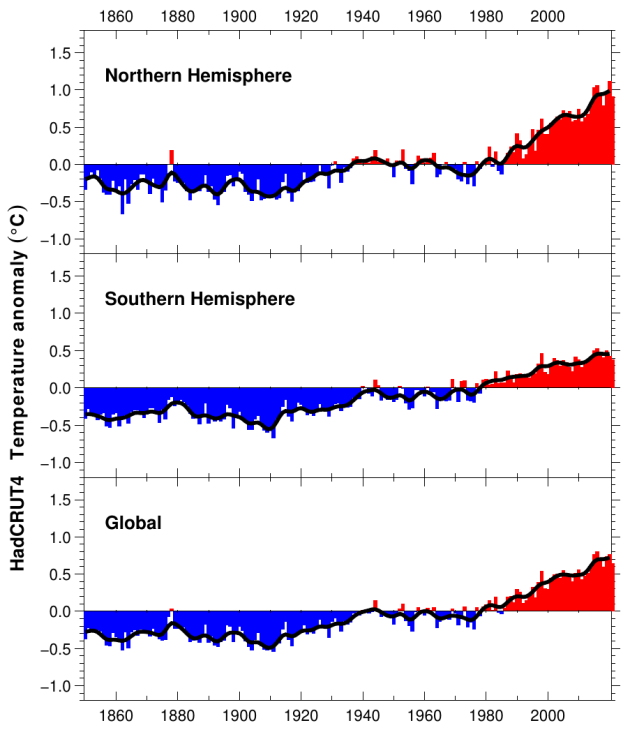
Here is the real MetOffice chart;
Several things leap out at me when I read your misleading post:
1) Dr. Jones was the DIRECTOR of Climatic Research Unit (CRU)
2) The chart I posted was based on HIS data from, HadCrut3 shown in the interview you never read:
"
A - Do you agree that according to the global temperature record used by the IPCC, the rates of global warming from 1860-1880, 1910-1940 and 1975-1998 were identical?
An initial point to make is that in the responses to these questions I've assumed that when you talk about the global temperature record, you mean the record that combines the estimates from land regions with those from the marine regions of the world.
CRU produces the land component, with the Met Office Hadley Centre producing the marine component.
Temperature data for the period 1860-1880 are more uncertain, because of sparser coverage, than for later periods in the 20th Century. The 1860-1880 period is also only 21 years in length. As for the two periods 1910-40 and 1975-1998 the warming rates are not statistically significantly different (see numbers below).
I have also included the trend over the period 1975 to 2009, which has a very similar trend to the period 1975-1998.
So, in answer to the question, the warming rates for all 4 periods are similar and not statistically significantly different from each other.
Here are the trends and significances for each period:"
red bolding mine
in the 2009 interview he was using
Hadcrut3 shown in the chart, where the obvious warming cooling cycles appear.
View attachment 192921
You never provided the link to your METOFFICE charts. Snicker............
3) you idiotically claimed that the chart I posted shows no cooling periods in them. You are willing to lie to yourself here since those cooling periods are OBVIOUS! The cooling periods from 1880-1900 and 1942-1978 are well known and easily seen in the big chart I posted using
HadCrut3 data.