Avging/smoothing on UAH graph to show clear warming

ScienceRocks

Democrat all the way!
Mar 16, 2010
59,455
6,793
1,900
The Good insane United states of America
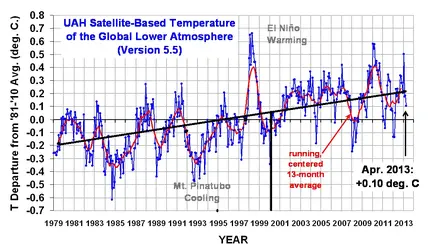
I have smoothed out all factors of ENSO, Solar cycles, volcano's, etc. When you get that you get this line. 1991 we had a big volcano which took until the later part of that decade to completely recover from, so I don't believe the .17-.2c of warming it gave off should be a starting point to judge current warming on. Secondly, 2002-2007 was a fairly warm period so it shouldn't count against a cool pattern that we have right now(late 2010-2013)...This period is similar to 1999-2001 and again the big la nina events of the 1960's-1970's.

Total warming since 1980--->.4c.
Total warming since 2000--->.15c
Between 1980-2000; we had .25c of warming; So .25/20=.0125c/year!!!
Of course the linear line slope is .0125/year of warming.
Total warming since 2005--->.09c
The rate of warming since 2005--->~.012857c/year

When I smooth out all these factors I get the black avg line...Showing .125/decade. This is spencer's UAH we're talking about and he is hated on as a skeptic big time.


(~=estimations) 1980-2000 could be exactly the rate of warming as today but I may of took slightly(.01+-) different points between 2005-2012 to come to my conclusion.

What do you think?
 

Attachments

  • $UAH_LT_1979_thru_Apr_2013_v5_5.png
    $UAH_LT_1979_thru_Apr_2013_v5_5.png
    26.9 KB · Views: 99
Last edited:
  • Thread starter
  • Banned
  • #2
This is a great temperature graph with nino avgs, nina avgs and the avg. https://skepticalscience.com/graphics.php?g=67

This clearly shows how big of a
1# 1991-1994=volcanic!
2# How big the 1997-1998 nino anomaly.
3# 2002-2007 were really warm years.
4# How cold 2011-2013 are.

What blows the minds of some people is the fact that 1999-2001 were very cold as we were within a similar nina pattern. Then 2002-2007 happened with neutral to nino years...So the forcing is like a arc throughout the past 13 years.

IF YOU WANT TO COMPARE; Compare 2000-2001 to 2011-2012!!!! Or 2008...All 3 of these events have near the same intensity on the climate system.

I think I remember 1999-2000 being about -1.6-1.7??? 2008 got down to -1.5? and again 2011 got down to -1.5 on the ONI. So these events are very close to each other in intensity. A year that is within +-.1 or .2 on the ONI is probably your best bet at comparing.
 

Attachments

  • $ENSO_Temps_500.gif
    $ENSO_Temps_500.gif
    377.8 KB · Views: 97
Last edited:
October 14, 2012 at 10:14 PM

The models are wrong


Today one mainstream newspaper finally caught up with the global warming skeptic community and recognized that a recent release of data from the United Kingdom’s Met Office shows that since 1996 the temperature of the climate has stalled. For the past sixteen years there has been no global warming, at all.

Three takeaways from this story.

•This period of no-warming has now been as long as the previous period of warming. In other words, the stall in warming is getting long enough now to be statistically significant.
•The Met Office revealed its biases by how it unveiled this fact. Previously, when their data suggested the climate was warming, they heralded that fact loudly with bold predictions of catastrophes to come. But when their data suggested their predictions were wrong and the climate wasn’t warming, they released the data with as little fanfare as possible.
•Finally, and most important, this data demonstrates clearly that all the computer models used by climate scientists to predict the future climate are patently wrong. They don’t understand what is happening, even if some of them refuse to admit it.

The last point is the most important. The early IPCC reports in the 1990s went into great detail about the many uncertainties that exist in the field. They didn’t know what the influence of pollution would be on future climate. They didn’t know what the influence of clouds would be on future climate. They didn’t know what the influence of the atmosphere’s water vapor would be on future climate. They didn’t know what the influence of variations of the Sun’s brightness would be on future climate.

And they didn’t know what the increase in carbon dioxide in the atmosphere would be on future climate. Compared to the amount of water vapor in the atmosphere, which is probably the atmosphere’s most significant global warming component, carbon dioxide is merely a trace gas. Making this trace gas important enough to cause global warming remains a difficult and overly complex theory, and a theory that has not yet been proven.

Those early IPCC reports were very honest about these uncertainties. Later IPCC reports however have dismissed these uncertainties, even though subsequent research has done practically nothing to eliminate them. Instead, the last two IPCC reports have trumpeted the climate models as if these models were the same as actual data. The models, based on theory, said that the increase in carbon dioxide was going to cause the climate to warm, and that was that. Turn off those heaters. Shut down those coal factories. Stop making cars. Learn to freeze in the winter and sweat in the summer. We can’t have technology any more because it is going to kill us!

The fact is that these models were garbage. They are useful for trying to understand how the atmosphere functioned, but as predictors they were less than worthless. None of them have ever been able to predict anything, and to rely on them to make policies that will squelch human freedom and creativity is beyond foolish.

Skeptics have been pointing out this obvious fact now for the better part of two decades. We now have proof that they were right.


The models are wrong | Behind The Black


Realville bites for the climate OC's.
 
Last edited:
  • Thread starter
  • Banned
  • #6
October 14, 2012 at 10:14 PM

The models are wrong


Today one mainstream newspaper finally caught up with the global warming skeptic community and recognized that a recent release of data from the United Kingdom’s Met Office shows that since 1996 the temperature of the climate has stalled. For the past sixteen years there has been no global warming, at all.

Three takeaways from this story.

•This period of no-warming has now been as long as the previous period of warming. In other words, the stall in warming is getting long enough now to be statistically significant.
•The Met Office revealed its biases by how it unveiled this fact. Previously, when their data suggested the climate was warming, they heralded that fact loudly with bold predictions of catastrophes to come. But when their data suggested their predictions were wrong and the climate wasn’t warming, they released the data with as little fanfare as possible.
•Finally, and most important, this data demonstrates clearly that all the computer models used by climate scientists to predict the future climate are patently wrong. They don’t understand what is happening, even if some of them refuse to admit it.

The last point is the most important. The early IPCC reports in the 1990s went into great detail about the many uncertainties that exist in the field. They didn’t know what the influence of pollution would be on future climate. They didn’t know what the influence of clouds would be on future climate. They didn’t know what the influence of the atmosphere’s water vapor would be on future climate. They didn’t know what the influence of variations of the Sun’s brightness would be on future climate.

And they didn’t know what the increase in carbon dioxide in the atmosphere would be on future climate. Compared to the amount of water vapor in the atmosphere, which is probably the atmosphere’s most significant global warming component, carbon dioxide is merely a trace gas. Making this trace gas important enough to cause global warming remains a difficult and overly complex theory, and a theory that has not yet been proven.

Those early IPCC reports were very honest about these uncertainties. Later IPCC reports however have dismissed these uncertainties, even though subsequent research has done practically nothing to eliminate them. Instead, the last two IPCC reports have trumpeted the climate models as if these models were the same as actual data. The models, based on theory, said that the increase in carbon dioxide was going to cause the climate to warm, and that was that. Turn off those heaters. Shut down those coal factories. Stop making cars. Learn to freeze in the winter and sweat in the summer. We can’t have technology any more because it is going to kill us!

The fact is that these models were garbage. They are useful for trying to understand how the atmosphere functioned, but as predictors they were less than worthless. None of them have ever been able to predict anything, and to rely on them to make policies that will squelch human freedom and creativity is beyond foolish.

Skeptics have been pointing out this obvious fact now for the better part of two decades. We now have proof that they were right.


The models are wrong | Behind The Black


Realville bites for the climate OC's.

Dude,

1# As I shown above it hasn't stopped when you avg(scatterpoint) throughout the past 20-30 years. Spencer is a skeptic that overlooks this data base for crying out loud.
2# The ENSO and Aerosals explains for the shape of the graph. Did you read my second post? Open up my second attachment and take a look at it. Both Nino and nina years are moving upwards at the same time. If it isn't warming then wtf is it doing?
3# Science evolves as we learn more about the workings of our climate system. 10 years ago we just didn't understand how nina's and nino's work. 30 years ago we didn't even know about the enso!!!! Please think. Sure, the models are somewhat wrong but not because of what we understood at the time being wrong. :eusa_whistle: Quite the opposite it was what we didn't.

Show me how that graph and data is wrong. Spencer attacks global warming.
 
Last edited:
Lessons from Past Predictions: Hansen 1981

The global surface temperature record has improved since 1981, at which time the warming from 1950 to 1981 had been underestimated. Thus Figure 5 uses a baseline of 1971 to 1991 (sets the average temperature anomaly between 1971 and 1991 at zero), because we are most interested in how well the model projected the warming since 1981. As the figure shows, the model accuracy has been very impressive.

The linear warming trends from 1981 through 2011 are approximtely 0.17°C per decade for Hansen's Fast Growth scenario, 0.13°C per decade for the Slow Growth scenario, vs. 0.17°C per decade for the observed global surface temperature from GISTEMP. Estimating that the actual energy growth and greenhouse gas emissions have fallen between the Fast and Slow Growth scenarios, the observed temperature change has been approximately 15% faster than the projections of the Hansen et al. model.

Contrary to the lies of the yappers, the consistant record of the models is that they have underestimated the warming. Nobody even whispered about the possibility of the Arctic Ice having a complete melt by 2020. In fact, they were dismissed as alarmists because they were talking of an ice free Arctic for part of the summer in 2100.
 
October 14, 2012 at 10:14 PM

The models are wrong


Today one mainstream newspaper finally caught up with the global warming skeptic community and recognized that a recent release of data from the United Kingdom’s Met Office shows that since 1996 the temperature of the climate has stalled. For the past sixteen years there has been no global warming, at all.

Three takeaways from this story.

•This period of no-warming has now been as long as the previous period of warming. In other words, the stall in warming is getting long enough now to be statistically significant.
•The Met Office revealed its biases by how it unveiled this fact. Previously, when their data suggested the climate was warming, they heralded that fact loudly with bold predictions of catastrophes to come. But when their data suggested their predictions were wrong and the climate wasn’t warming, they released the data with as little fanfare as possible.
•Finally, and most important, this data demonstrates clearly that all the computer models used by climate scientists to predict the future climate are patently wrong. They don’t understand what is happening, even if some of them refuse to admit it.

The last point is the most important. The early IPCC reports in the 1990s went into great detail about the many uncertainties that exist in the field. They didn’t know what the influence of pollution would be on future climate. They didn’t know what the influence of clouds would be on future climate. They didn’t know what the influence of the atmosphere’s water vapor would be on future climate. They didn’t know what the influence of variations of the Sun’s brightness would be on future climate.

And they didn’t know what the increase in carbon dioxide in the atmosphere would be on future climate. Compared to the amount of water vapor in the atmosphere, which is probably the atmosphere’s most significant global warming component, carbon dioxide is merely a trace gas. Making this trace gas important enough to cause global warming remains a difficult and overly complex theory, and a theory that has not yet been proven.

Those early IPCC reports were very honest about these uncertainties. Later IPCC reports however have dismissed these uncertainties, even though subsequent research has done practically nothing to eliminate them. Instead, the last two IPCC reports have trumpeted the climate models as if these models were the same as actual data. The models, based on theory, said that the increase in carbon dioxide was going to cause the climate to warm, and that was that. Turn off those heaters. Shut down those coal factories. Stop making cars. Learn to freeze in the winter and sweat in the summer. We can’t have technology any more because it is going to kill us!

The fact is that these models were garbage. They are useful for trying to understand how the atmosphere functioned, but as predictors they were less than worthless. None of them have ever been able to predict anything, and to rely on them to make policies that will squelch human freedom and creativity is beyond foolish.

Skeptics have been pointing out this obvious fact now for the better part of two decades. We now have proof that they were right.


The models are wrong | Behind The Black


Realville bites for the climate OC's.

Dude,

1# As I shown above it hasn't stopped when you avg(scatterpoint) throughout the past 20-30 years. Spencer is a skeptic that overlooks this data base for crying out loud.
2# The ENSO and Aerosals explains for the shape of the graph. Did you read my second post? Open up my second attachment and take a look at it. Both Nino and nina years are moving upwards at the same time. If it isn't warming then wtf is it doing?
3# Science evolves as we learn more about the workings of our climate system. 10 years ago we just didn't understand how nina's and nino's work. 30 years ago we didn't even know about the enso!!!! Please think. Sure, the models are somewhat wrong but not because of what we understood at the time being wrong. :eusa_whistle: Quite the opposite it was what we didn't.

Show me how that graph and data is wrong. Spencer attacks global warming.


s0n......you miss the point. Ummm.....the operative word above is "predictor".


Anyway.....those temperature numbers are insignificant, and tell me, why do they always pulish the numbers on the far end of the spectrum??:D


And wake the fuck up s0n......they said more and bigger hurricanes = fAiL


They said more frequent tornado's =fAiL


They said we wouldnt see snow, perhaps for decades. We see more snow than ever.


fAiL.
 
Avging/smoothing on UAH graph to show clear warming
Right....If the data doesn't match the dire predictions, "avg/smooth" the data. :lmao:

What level of math have you reached? Enso, volcano's, solar cycles and aerosols are all going to cause noise. Enso is the main one we have to wash out...Look at similar ENSO events to see that they're also warming. One 20 years ago wouldn't produce this kind of temperature.


God I can't wait until we're finished with this string of nina's. Going back to 2002-2007 would be quite interesting. Think of that but .1-.12c warmer or a 1998 that goes into the mid .7's for the red avg line and .9c-1.0c for a month or two. ON THE FIRST GRAPH!
 
Last edited:
I really am not looking forward to the next jump in temperatures. The present increase in ocean temperatures is a case in point. Warming at depth is not something we really want. Clathrates let go, and the whole worst case scenerios we have at present, will look like best case scenerious.
 
Avging/smoothing on UAH graph to show clear warming
Right....If the data doesn't match the dire predictions, "avg/smooth" the data. :lmao:

What level of math have you reached? Enso, volcano's, solar cycles and aerosols are all going to cause noise. Enso is the main one we have to wash out...Look at similar ENSO events to see that they're also warming. One 20 years ago wouldn't produce this kind of temperature.


God I can't wait until we're finished with this string of nina's. Going back to 2002-2007 would be quite interesting. Think of that but .1-.12c warmer or a 1998 that goes into the mid .7's for the red avg line and .9c-1.0c for a month or two. ON THE FIRST GRAPH!


yuk......yuk.........

Not so sure if these guys are impressed with the "smoothing".........


Cooling in the Arctic: what to expect? : The Voice of Russia: News, Breaking news, Politics, Economics, Business, Russia, International current events, Expert opinion, podcasts, Video


Maybe they were paid off by Exxon/Mobil:deal:


ANyway.......what the hell is the point of all the angst? Tell me what is the point? Even if the temps go waaaaaay up like you nuts are hoping for, we're fucked anyway. Might as well be stark naked in the middle of Siberia in January screaming "FIRE!!!". Better start praying for some spectacular technological breakthroughs because turning back technology to the 1850's like you nuts would prefer isnt happening........like ever.


You gotta think about shit like this before professing everybody else to be stupid idiots.:eusa_dance:


According to the UN........the cost of going green would cost 1.9 trillion dollars per year for 40 years.


http://www.foxnews.com/opinion/2011/07/06/even-un-admits-that-going-green-will-cost-76-trillion/


Guess what dumbasses???????:up:


You meatheads go tell people that tomorrow, they gotta give up their fancy iPhones and take a bike to work!!!:fu::fu::fu::fu::fu::fu:
 
Last edited:
•This period of no-warming has now been as long as the previous period of warming.

No it hasn't.


Didn't you denialists say the warming was natural? Well how can it be natural - or anything - if it doesn't exist?


Ummmmmm, the IPCC says it hasn't warmed, the UK's Met Office says it hasn't warmed and now Hansen says it hasn't warmed. So, you tell the warmers what's going on.....it's them saying it now...


Then why have the denialists maintained the warming is natural?
 

Forum List

Back
Top