Arctic Sea Ice back to NORMAL!!!

Antarctice ice back to normal? Here's why!

Svensmark's theory explains arctic - antarctic ice coverage dichotomy - sci.physics | Google Groups

> The cosmic-ray and cloud-forcing hypothesis therefore predicts that
> temperature changes in Antarctica should be opposite in sign to
> changes in temperature in the rest of the world. This is exactly what
> is observed, in a well-known phenomenon that some geophysicists have
> called the polar see-saw, but for which “the Antarctic climate
> anomaly” seems a better name (Svensmark 2007). To account for evidence
> spanning many thousands of years from drilling sites in Antarctica and
> Greenland, which show many episodes of climate change going in
> opposite directions, ad hoc hypotheses on offer involve major
> reorganization of ocean currents. While they might
> be possible explanations for low-resolution climate records, with
> error-bars of centuries, they cannot begin to explain the rapid
> operation of the Antarctic climate anomaly from decade to decade as
> seen in the 20th century (figure 6). Cloud forcing is by far the most
> economical explanation of the anomaly on all timescales. Indeed,
> absence of the anomaly would have been a decisive argument against
> cloud forcing – which introduces a much-needed element of refutability
> into climate science.


> http://www.phys.uu.nl/~nvdelden/Svensmark.pdf

All of the things blamed on global warming
 
yet more bad news for the green k00ks......................:tomato:

Climate change, happening before your eyes | Herald Sun Andrew Bolt Blog


......of course, they'll dredge up some bs k00k site about "averages" or some shit.........but the poop is, this link is up at Dridge right now and 25 million people will see it by days end. As they say..........reality is 95% perception. Fake data......k00k e-mails.......the skeptics case grows by the day in the minds of the majority.

And Im laughing.........10 years ago, I publically stated that this global warming hoax would be exposed as a fraud. Now......even the politicians in the most lefty districts dont want to talk about it because it is radioactive.......as in fAil!!!!!!!!


:funnyface::funnyface::funnyface:


Geez............gotta be a bitch being a k00k lefty these days.:clap2:

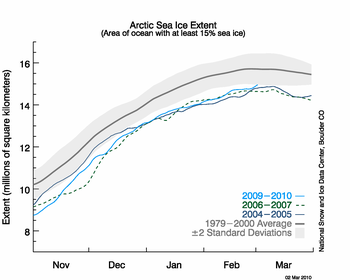
The data from your site purports to have come from the National Snow and Ice Data Center. On that website, we read:

During February 2010, ice extent grew at an average of 25,700 square kilometers (9,900 square miles) per day. Sea ice extent increased at a fairly steady rate in the early part of the month and then slowed after the middle of February. Ice extent remained more than two standard deviations below the 1979 to 2000 average throughout the month.

It's gotta be a bitch just making up data as you go along these days. The itainthappenin' websites have to do just that in order to have any stories to print, as this thread illustrates.

Hmm, thats funny cause they said this about the 2009 maximum as well...

Arctic Sea Ice News & Analysis
In the beginning of March, ice extent began to decline, and it appeared that Arctic sea ice had reached its maximum extent. However, in the second week of March the ice edge began to expand again. Ice extent grew through much of the month of March, but it did not expand to the level seen on February 28.

Such ups and downs in Arctic sea ice extent are not unusual near the annual maximum. As discussed in our March 3 post, the ice edge at this time of year consists of thin ice that is sensitive to temperature changes, and easily redistributed by storm winds.

Strange huh... Why if you go through the site and pick at certain sentences or single paragraphs you make any kind of claim you wanted to..... Like you did...

Cherry picking isn't debunking anymore than it is evidence....
 
As I said...........the k00ks pound you with #'s that nobody cares about anymore. Alas......they are now looked upon as the fringe, stuck in 2002.

But the bottom line is that tens of millions are seeing the headline tonight "Arctic Sea Ice Back To Normal" so.........another nail in the coffin as most wont bother to read the detail. But like I said in post numero uno..........reality is 95% perception s0ns!!!!

Yea like the President was born in Hawaii, any proof, no but enough people want to believe it that it becomes fact. Same with how really bright he is, no proof at all but tell a bunch of dweebs that he went to Harvard and edited the Harvard Law Review and they will believe it because they want to.
 
yet more bad news for the green k00ks......................:tomato:

Climate change, happening before your eyes | Herald Sun Andrew Bolt Blog


......of course, they'll dredge up some bs k00k site about "averages" or some shit.........but the poop is, this link is up at Dridge right now and 25 million people will see it by days end. As they say..........reality is 95% perception. Fake data......k00k e-mails.......the skeptics case grows by the day in the minds of the majority.

And Im laughing.........10 years ago, I publically stated that this global warming hoax would be exposed as a fraud. Now......even the politicians in the most lefty districts dont want to talk about it because it is radioactive.......as in fAil!!!!!!!!


:funnyface::funnyface::funnyface:


Geez............gotta be a bitch being a k00k lefty these days.:clap2:

The data from your site purports to have come from the National Snow and Ice Data Center. On that website, we read:


It's gotta be a bitch just making up data as you go along these days. The itainthappenin' websites have to do just that in order to have any stories to print, as this thread illustrates.

Hmm, thats funny cause they said this about the 2009 maximum as well...

Arctic Sea Ice News & Analysis
In the beginning of March, ice extent began to decline, and it appeared that Arctic sea ice had reached its maximum extent. However, in the second week of March the ice edge began to expand again. Ice extent grew through much of the month of March, but it did not expand to the level seen on February 28.

Such ups and downs in Arctic sea ice extent are not unusual near the annual maximum. As discussed in our March 3 post, the ice edge at this time of year consists of thin ice that is sensitive to temperature changes, and easily redistributed by storm winds.

Strange huh... Why if you go through the site and pick at certain sentences or single paragraphs you make any kind of claim you wanted to..... Like you did...

Cherry picking isn't debunking anymore than it is evidence....

Actually, i read the whole site. Nowhere, but nowhere does it say that the extent of sea ice is back to normal. That little piece of information was made up of whole cloth, pure and simple, fabricated to make a point. Two standard deviations below the mean is the operative phrase, not back to normal. It's like saying that a kid that made the first percentile on a test was about average.
 
Actually, i read the whole site. Nowhere, but nowhere does it say that the extent of sea ice is back to normal. That little piece of information was made up of whole cloth, pure and simple, fabricated to make a point. Two standard deviations below the mean is the operative phrase, not back to normal. It's like saying that a kid that made the first percentile on a test was about average.


Please see this link. The current ice graphs at about exactly the average of the 30 year test period.

http://nsidc.org/data/seaice_index/images/daily_images/N_stddev_timeseries.png
 
The graph I posted is more recent than yours. Yours near the end of February, mine near the end of March.

OK, I found your graph in the updated daily section of the website. I wonder how the data could take such a jump in one month? Two standard deviations below up to the mean is quite a change in a very short time. Perhaps this (also from the website) could be the explanation:

Do your data undergo quality control?

The daily and monthly images that we show in Arctic Sea Ice News & Analysis are near-real-time data. Near-real-time data do not receive the rigorous quality control that final sea ice products enjoy, but it allows us to monitor ice conditions as they develop.

Several possible sources of error can affect near-real-time images. Areas near land may show some ice coverage where there isn’t any because a land filter has not yet been applied and the sensor has a coarse resolution. Sometimes, the data we receive have geolocation errors, which could affect where ice appears. Near-real-time data may also have areas of missing data, displayed on the daily map as gray wedges, speckles, or spider web patterns. In addition, satellite sensors occasionally have problems and outages, which can affect the near-real-time data. We correct these problems in the final sea ice products, which replace the near-real-time data in about six months to a year.

I take back what I posted about the data having been made up, but still, they are quite suspect, don't you think?
 
That' interesting.

Here is the same graph, as shown on the nsidc website:

Note the map legend showing + or - two standard deviations.

How do you account for the difference between these two graphs?

I don't have to account for the two graphs they do.... You want to know why the two are so different? Ask them or complain to them about it....

But more importantly why not just post the image? Why the follow this link BS when you could just post it in the response? Like this...

20100303_Figure2_thumb.png


I can tell you why.... Because the dam image was so small you can't tell what it said at all or what it meant....

Now again my post to you was to point out the fact if you choose to you can go through the site and find all sorts of conflicting statements and data.... Cherry picking each one and claiming it contradicts the other is silly. Both sides can do it easily....
 
OK, I found your graph in the updated daily section of the website. I wonder how the data could take such a jump in one month? Two standard deviations below up to the mean is quite a change in a very short time. Perhaps this (also from the website) could be the explanation:


I take back what I posted about the data having been made up, but still, they are quite suspect, don't you think?


Suspect? Yes. But that is what there is to work with. Many tout the "Instrument Record" as being vastly superior to the Proxy data which covers the period before. It probably is as far as it goes, but, seriously, the vast majority of those early reading for temperature were taken by some old codger in a bathrobe and slippers, perhaps with and perhaps without his reading glasses perhaps at the same time of day and perhaps not, perhaps one per day and perhaps two with averaging.

To compound this, the "stations" for the readings were not scientifically placed, many still are not, and the "instruments" were by today's standards, crude.

We are calculating the shift in climate to the 100th of a degree from a starting point that was recorded using a glass tube with mercury mounted to a wooden plank with hand drawn hash marks. A 5th grader conducting a science experiment today uses equipment with a greater degree of accuracy.

"Suspect" does little to define the ludicrous nature of this "science".

Today's satellite data gathering is about as good as it gets. There is an almost real time average of the globe taken with a common instrument, common calculations and common methodology.

However, the ice at the poles is measured by satellites and the technicians offer the caveat of innaccuracy. Maybe ALL of the data is suspect. If that's the case, then NOBODY knows what they are talking about and suddenly all of the departures of the actual performance of the climate from the expert predictions are explained.

Of course, I could be wrong.
 
Here's the whole article:

NASA Admits that 1934, Not 1998, was the Warmest Year on Record
Published August 14, 2007 by:
Brant McLaughlin

In one more devastating blow against the global warming or "climate Apocalypse" supporters such as former Vice President Al Gore, NASA stated today
that it was wrong when it release a report that 1998 was the warmest year ever recorded in modern history.


Hey Rocks................pwned again:tomato::tomato::tomato:
 
Hey Rocks............you need to take my advice s0n...................

Anybody who makes 9,000 posts in 18 months about nothing but the environment has some fcukking issues.............ok??!!!! Try some Zoloft..........stuff is terrific at dealing with perseverative thought.........allows you to get past what you obsess upon and move on to other interests. Side effects are insignificant.
 
Here's the whole article:

NASA Admits that 1934, Not 1998, was the Warmest Year on Record
Published August 14, 2007 by:
Brant McLaughlin

In one more devastating blow against the global warming or "climate Apocalypse" supporters such as former Vice President Al Gore, NASA stated today
that it was wrong when it release a report that 1998 was the warmest year ever recorded in modern history.


Hey Rocks................pwned again:tomato::tomato::tomato:

Hmmm........ One usually posts the links to the article.

And I do believe that the position of NASA is that 1998 came in second to 2005.

Thus far, 2010 is shaping up to be one warm year, probably going to exceed either 1998 or 2005. And I'll bet that within three years, we will get another year that exceeds all three.

OK, Skooker, your turn. Are we going to cool, or warm. And your basis for your predictions are?:lol:

Wishful thinking and the moguls of rant radio, of course.
 
took obama less than two years.....dude is magical
He is the Magic Negro, you know. The LA Times confirmed it in 2006.

Don't worry about Rocks. I think he's paid by the post by the Huffpo or Daily Kos or Moveon.org. I can't imagine someone who claims that much education being that ignorant. It's gotta be willful.

Love the fact that the realization that wind has also played a much larger part in ice thickness than temperatures. It's the old theory of pushing ice around the glass by blowing on it at a global scale.
 
Hey Rocks............you need to take my advice s0n...................

Anybody who makes 9,000 posts in 18 months about nothing but the environment has some fcukking issues.............ok??!!!! Try some Zoloft..........stuff is terrific at dealing with perseverative thought.........allows you to get past what you obsess upon and move on to other interests. Side effects are insignificant.
I reiterate. Paid disinformation disseminator. No other result makes sense.
 
If 9th's of the planet froze solid, Al 'Global Warming' Gore, would still be crying, probably saying something like, 'We're in an ice age now because of global warming'. The guy belongs with that other idiot that thinks, Guam is going to tip over. :lol: Their all :cuckoo:

And the hilarious part is, they have power and influence! And no one can dislodge them.
 

Forum List

Back
Top