"You're not even trying to defend your stupid and dishonest tactic of looking at the short term instead of the trend. You just repeat your fallacy over and over. Making the same mistake with 4 different graphs doesn't make it any less of a mistake."
Mamooths pathetic reply since he IGNORED this chart that showed
BOTH short trends in it:
Never once disputed that there has been a decline since 1979, even said so right here!
"For one thing most skeptics have acknowledged the decline, which happened before nearly 100 years earlier, then it came back up to the probably Century high in the late 1970's, before a new decline sets in."
You are a grossly dishonest person, one who deliberately ignore what others say because you are so wedded to a belief that you will twist or lie on anything to maintain your delusions. Skeptical science chart was misleading and dishonest, which is why I exposed it in
POST 13, showing that declines and increases are cyclic, that skeptics don't dispute the decline, while YOU and others are resisting hard evidence that it is NOT currently declining and hasn't for 12 years now.
SSDD, shows a chart from a published paper showing a much longer cycle in which a similar low point was in the late 1920's to the early 1940's, to reach the century high in the early 1970's, similar to my statement I posted:
"then it came back up to the probably Century high in the late 1970's, "
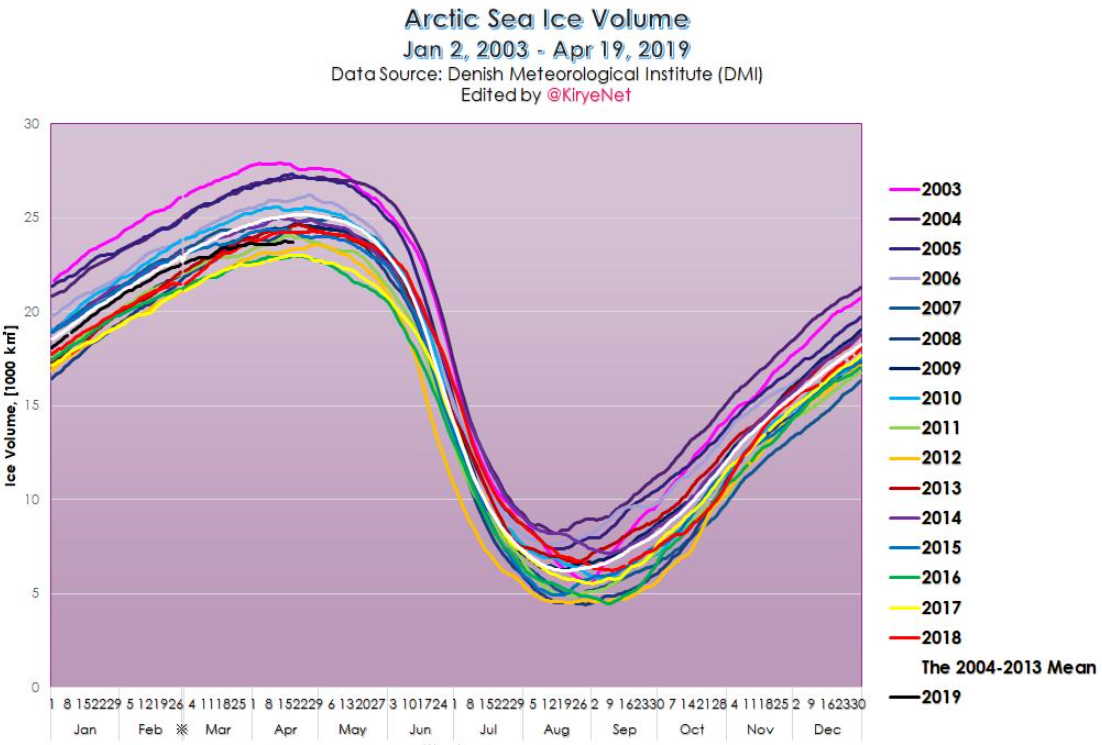
You have tried hard to ignore the two sources showing a flat to a slight increase in ice cover since 2007, you once again show your overt dishonesty by posting a skeptical science chart starting in 1979, while the two charts I posted started in 2007 to show it is not declining anymore, in DEFIANCE to warmists scientists who predicted it would be all gone in the Summer time.
You are as usual pathetic in your dishonest lying presentations.