
RollingThunder
Gold Member
- Mar 22, 2010
- 4,818
- 522
- 155
- Thread starter
- #261
Stupid drivel! As I said, your denier cult myths about the temperature record are retarded anti-science garbage.And, factual!!!!!Your already debunked denier cult myths, about the accuracy of the world temperature records, are worthless garbage based on conspiracy theory ideation and are therefore of no interest to me. Your mental masturbation over sound science that you are seemingly incapable of comprehending has no significance, except to the other crackpot denier cult devotees. Go play with yourself.The sensors that the temperature readings come from. Where are they?What do you imagine you're talking about?where are the sites that are used?So we've got hundreds of thousands of scientists (at least) all around the world who, on the basis of overwhelming evidence from many fields of science and many kinds of measurements, have concluded that the Earth is warming due to the elevated CO2 levels. Then, on the other side, we have some ideologically motivated rightwingnuts like SSooooDDuuumb who cherry-pick data sets, like just the satellite record of a portion of the atmosphere, and often limited time frames, like from 1998 to present, to foolishly deny the warming of our planet that has become completely obvious to most people and almost all scientists.
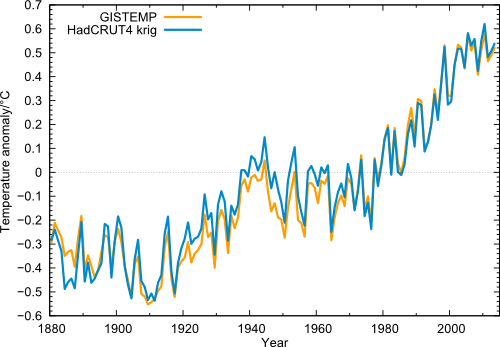
Here's the complete temperature graph...
And like I thought, you have no knowledge of where the sensors are at. You are a parrot!!!!! Does Polly want a cracker. Oh, you are already a cracker.
The Berkeley Earth Surface Temperatue Study
About the Data Set
The Berkeley Earth Surface Temperature Study has created a preliminary merged data set by combining 1.6 billion temperature reports from 16 preexisting data archives. Whenever possible, we have used raw data rather than previously homogenized or edited data. After eliminating duplicate records, the current archive contains over 39,000 unique stations. This is roughly five times the 7,280 stations found in the Global Historical Climatology Network Monthly data set (GHCN-M) that has served as the focus of many climate studies. The GHCN-M is limited by strict requirements for record length, completeness, and the need for nearly complete reference intervals used to define baselines. We have developed new algorithms that reduce the need to impose these requirements (see methodology), and as such we have intentionally created a more expansive data set.
Summary of Findings
Berkeley Earth has just released analysis of land-surface temperature records going back 250 years, about 100 years further than previous studies. The analysis shows that the rise in average world land temperature globe is approximately 1.5 degrees C in the past 250 years, and about 0.9 degrees in the past 50 years. Berkeley Earth also has carefully studied issues raised by skeptics, such as possible biases from urban heating, data selection, poor station quality, and data adjustment. We have demonstrated that these do not unduly bias the results.

