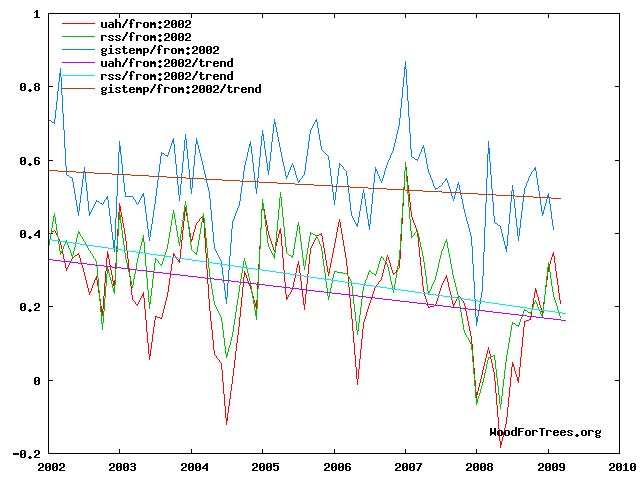
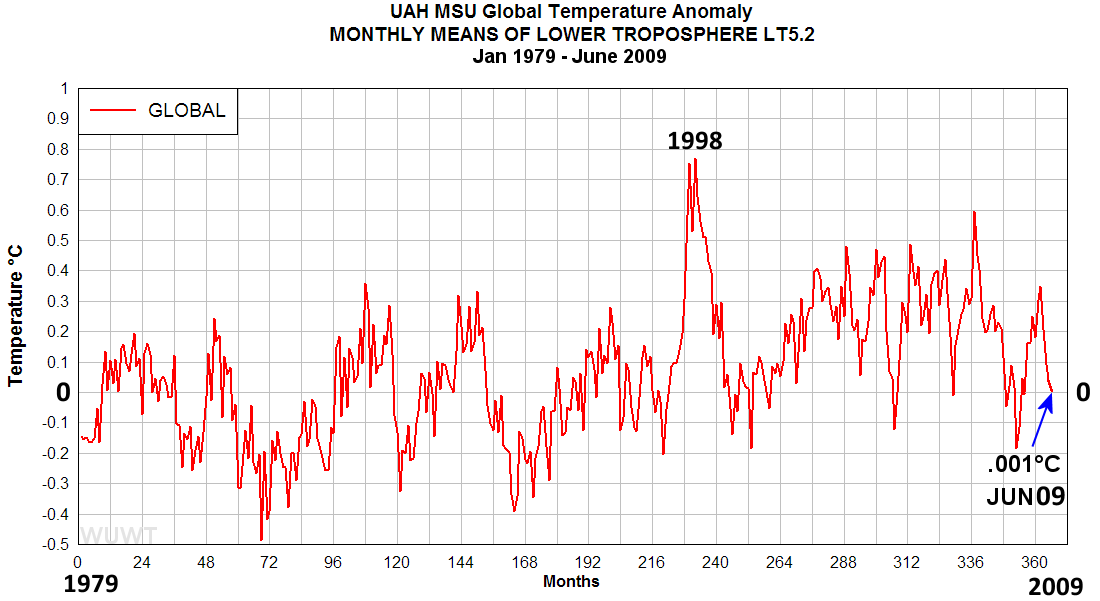
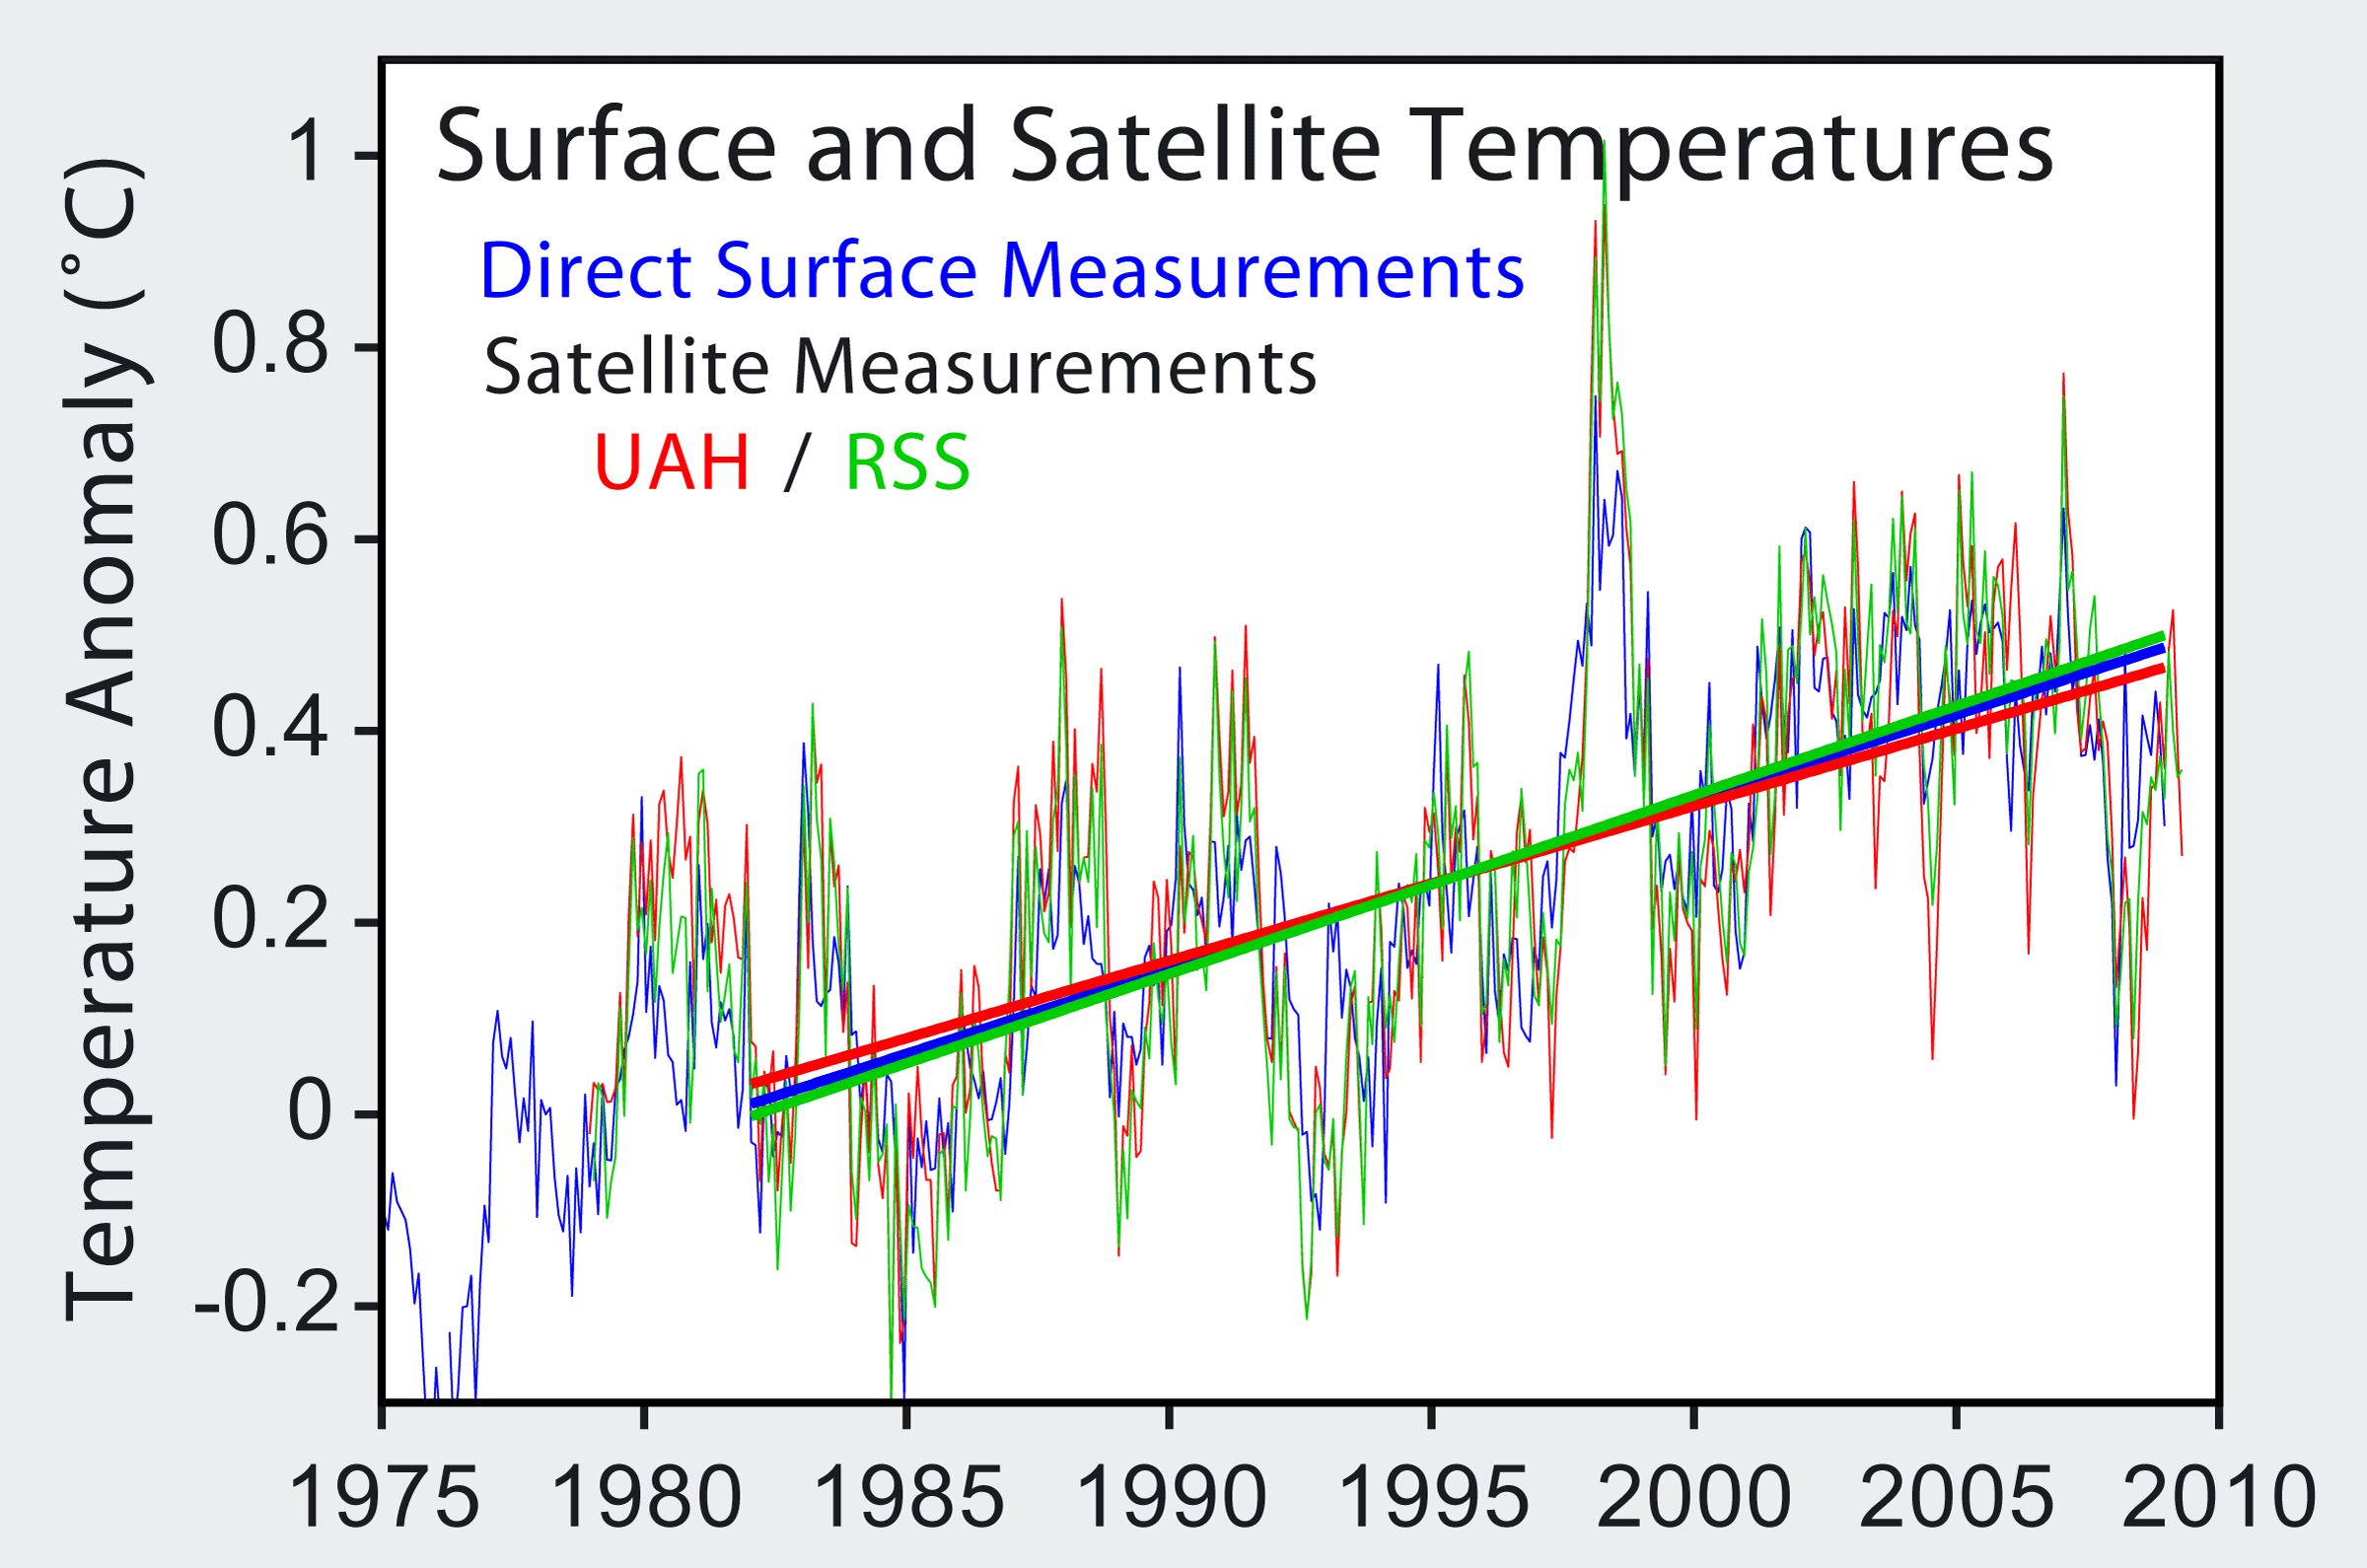
Geez, Sinatra, you are proving what an idiot you truly are. Run a line across the top temps of the satellite data, what is the slope of the line? Now run one across the bottoms temps of the satellite data. What is the slope of the line?
As for your other charts, until I see the source of each, something a bit better than Kellercitylimits.com, I will regard them as gigo.
Don't fear the truth old timer.
And if you wish to now utilize the lesser sun activity and ocean trends as the primary cause of the global cooling, would not the same sources also apply for warming trends - so the sun and the oceans actually play a far more significant role than humankind regarding impacts upon earth's climate?
Regardless, as for now, the earth is cooling...