Look how much warmer we are today than 12 years ago...

Used to be that we only had to listen to horseshit from the tree huggers and those silly P.E.T.A. folks. Now we have the environmental wackos to add to the groups of clowns.. All of these groups, plus the addition of the Democrats, keeps me chuckling all the time! The only thing more irritating than any of the above mentioned dopes is an ex-smoker or ex-wife.:lol:
 
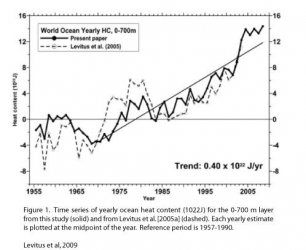
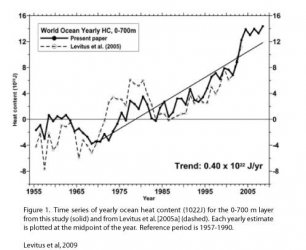
Not just 2 cherry picked years here...
 

Attachments

  • $argo.jpg
    $argo.jpg
    31.2 KB · Views: 52
So the 1930s were a cold decade?

Hmmmmm....

Well, look at the chart. The thirties were warm, but not that warm, compared to the last 30 years.

So according to you and Chris, the sun was at a low activity point in the 1930s and yet the temps were high.

Explain.

Hey dingbat, look at the chart. The sun is at a very low period of activity right now, yet look at where we are on that chart.
 
Used to be that we only had to listen to horseshit from the tree huggers and those silly P.E.T.A. folks. Now we have the environmental wackos to add to the groups of clowns.. All of these groups, plus the addition of the Democrats, keeps me chuckling all the time! The only thing more irritating than any of the above mentioned dopes is an ex-smoker or ex-wife.:lol:

Hey, smoke up a storm. Leaves more of the SS income for the more intelligent of us.:lol:
 
Well, look at the chart. The thirties were warm, but not that warm, compared to the last 30 years.

So according to you and Chris, the sun was at a low activity point in the 1930s and yet the temps were high.

Explain.

Hey dingbat, look at the chart. The sun is at a very low period of activity right now, yet look at where we are on that chart.


Name calling now?

It would appear you are realizing your own demise per this subject of global warming...er, cooling..., er climate change....

You stated the earth had cooled recently due to low sunspot activity. You/Chris also remarked the sunspot activity was at its lowest in 80 years - but 80 years ago, the earth was in a warming trend.

Just trying to follow your path of logic - or lack thereof.
 

Attachments

  • $argo.jpg
    $argo.jpg
    31.2 KB · Views: 53
Last edited:
So according to you and Chris, the sun was at a low activity point in the 1930s and yet the temps were high.

Explain.

Hey dingbat, look at the chart. The sun is at a very low period of activity right now, yet look at where we are on that chart.


Name calling now?

It would appear you are realizing your own demise per this subject of global warming...er, cooling..., er climate change....

You stated the earth had cooled recently due to low sunspot activity. You/Chris also remarked the sunspot activity was at its lowest in 80 years - but 80 years ago, the earth was in a warming trend.

Just trying to follow your path of logic - or lack thereof.

Get real. We are far warmer than we were in the '30s. And we are at a solar minimum, and had a La nina. Yet most of the last four years have ranked in the top ten of the last 150 years for heat.
 
We're not warming. At all.
The Argo Buoys told us this.... But because they didn't give the AGW Church what it wanted, few have ever heard of them.

Sure, fellow, sure.


Solar heating of the oceans - diurnal, seasonal and meridional variation
J. D. Woods, W. Barkmann, A. Horch
Institut für Meereskunde an der Universität Kiel


Abstract
Solar heating is an important factor in modelling the upper boundary layer of the ocean. It influences not only the temperature, but also the depth of the mixed layer and must be taken into account in circulation dynamics. The study reported in this paper was designed to reveal the principal features of the global climatology of solar heating in the ocean, with such applications in mind. The meridional, seasonal and diurnal variations of the vertical distribution of solar heating inside the ocean, expressed in terms of I(z), the rate of heat accumulation below depth z, and (z) = (1/c). dzI(z), the rate of temperature rise, are calculated for given values of cloud cover and seawater turbidity (expressed in terms of Jerlov's water types) using a model that incorporates a new parametrization of I(z)/I(0), which is shown to be more accurate than previous versions. At present there exist no reliable global climatologies of cloud cover and seawater turbidity, so the values of the corresponding parameters are held constant in each computation, which is then repeated using parameter sets covering the full ranges from clear to overcast sky, clear to turbid ocean water. It is found that uncertainty in cloud cover is more important in the mixed layer, and uncertainty in seawater turbidity is more important below. The results presented in this paper are mainly concerned with solar heating below the mixed layer. It is calculated that the annual temperature rise can exceed 1 K and the annual heat accumulation can exceed 100 MJ/m2 below the mixed layer in the tropics. At higher latitudes solar heating produces similar heating rates in summer, but the stored heat is extracted locally in winter when the mixed layer depth exceeds the maximum depth of solar heating, defined here by a daily temperature rise of 1 mK or a heat flux of 86.4 KJ/m2d (=1 W/m2). The sensitivity of the seasonal and meridional variations of the maximum depth of solar heating to cloud cover and seawater turbidity is investigated. The actual change of temperature due to solar heating in the seasonal thermocline at Ocean Weather Station C is calculated using Bunker's monthly mean cloud cover and Jerlov's seawater turbidity. Extension of such calculations to the whole of the World Ocean must await the publication of global climatologies of cloud cover and seawater turbidity, which are expected to be derived from satellite observations during the next decade.
A solar heating climatology is a prerequisite for computation of the thermal response of the ocean to CO2 pollution of the atmosphere. The implications of the results obtained from the present study are discussed. An early rise in tropical sea surface temperature seems likely, but exact prediction will be hindered by uncertainty in the turbidity of the tropical ocean.

Wiley InterScience :: Session Cookies
 
We're not warming. At all.
The Argo Buoys told us this.... But because they didn't give the AGW Church what it wanted, few have ever heard of them.

Really, no warming at all?

Nature isn't just a bitch, she's a cold hearted bitch, indiscriminating, killing whore that does as she pleases, can't control her, (but could we piss her off?).

Argo - part of the integrated global observation strategy

Can you please forward this information to Algorical and the Cap n Tax crowd?
 
Hey dingbat, look at the chart. The sun is at a very low period of activity right now, yet look at where we are on that chart.


Name calling now?

It would appear you are realizing your own demise per this subject of global warming...er, cooling..., er climate change....

You stated the earth had cooled recently due to low sunspot activity. You/Chris also remarked the sunspot activity was at its lowest in 80 years - but 80 years ago, the earth was in a warming trend.

Just trying to follow your path of logic - or lack thereof.

Get real. We are far warmer than we were in the '30s. And we are at a solar minimum, and had a La nina. Yet most of the last four years have ranked in the top ten of the last 150 years for heat.

Simply not true - at least utilizing the US temp records, which are the most accurate due to numbers of stations. You are aware of the data infill that takes place with the historical global temp data, yes?

I suggest you educate yourself far more on this subject - you persist in spouting long-dismissed falsities as fact and your reputation continues to be the worse for it...

Here is some Greenland data: (since the global warmers are so concerned with Greenland's ice melting and causing the seas to rise)

Atlantic+Multidecadal+Oscillation.gif


The 1930s and 1940s were warmer than present time - considerably so.

Same goes for the Arctic:

Arctic+temperatures+since+1900.jpg


Now let us turn to the United States temp. data specifically. This data was quietly revised after faults had been discovered in its tabulations - faults that incorrectly placed 1998 as the warmest recorded year in the US records. You see, it is far more difficult to infill temp data with the US records as there remains an abundance of surface temp station data for over 100 years. (though such infill and trending takes place - most recently by NOAA which showed significant discrepancies when compared to NASA data) Just like the more recent and accurate satellite temp data from 1979 to present is far more difficult to manipulate - data that shows we are hardly warmer now than 1979 when the earth was coming out of a cold spell.

6 of the top 10 warmest years of US temps were prior to 1960. Four of the top 10 were in the 1930s - twice as much as any other decade.

These facts are shown clearly in the following graph, which does not even account for the cooling of the most recent decade - here we see that 1998 - the oft repeated high point of the global warmers, was far less warm than many periods prior to 1950:

hammer-graph-5-us-temps.jpg


And when adding the most recent yearly temp data, we now see the clearly downward trend...

6a010536b58035970c01156ff0861d970c-800wi


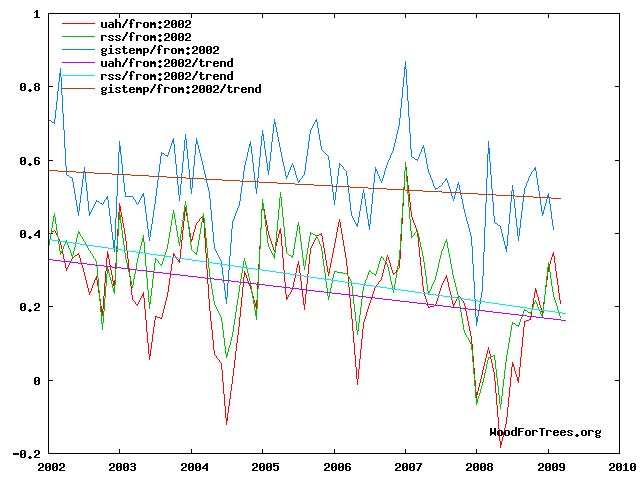
Global temps are in decline as well...

global-temp-2003-2008.jpg


trend-of-60-month-slopes1.jpg


VOOROTRENDS.jpg


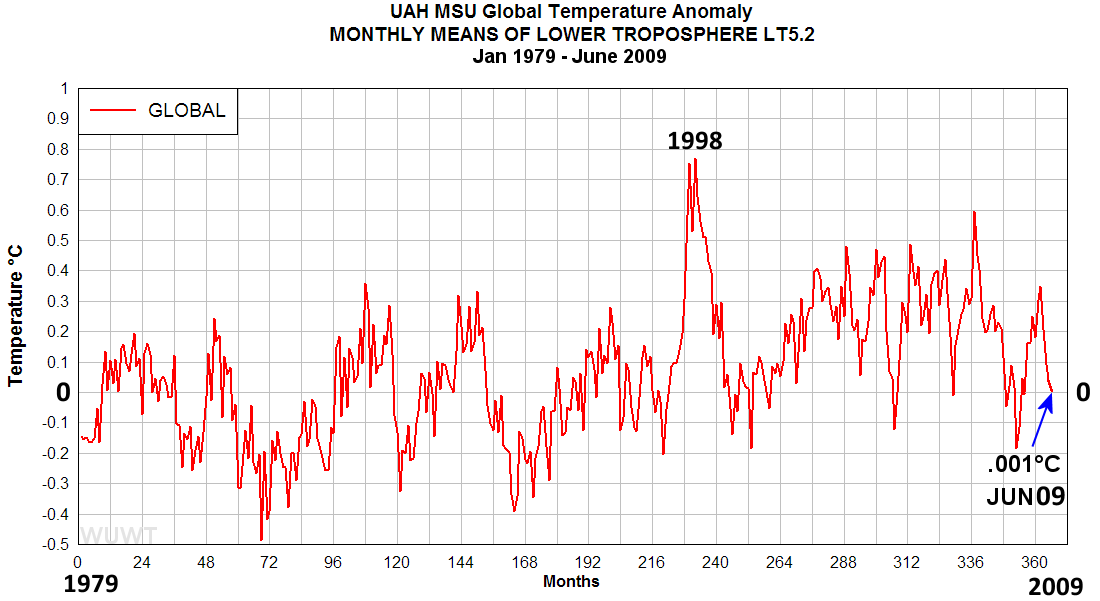
And the all-important and far more accurate satellite data...

uah_jun09.png
 
Hey dingbat, look at the chart. The sun is at a very low period of activity right now, yet look at where we are on that chart.


Name calling now?

It would appear you are realizing your own demise per this subject of global warming...er, cooling..., er climate change....

You stated the earth had cooled recently due to low sunspot activity. You/Chris also remarked the sunspot activity was at its lowest in 80 years - but 80 years ago, the earth was in a warming trend.

Just trying to follow your path of logic - or lack thereof.

Get real. We are far warmer than we were in the '30s. And we are at a solar minimum, and had a La nina. Yet most of the last four years have ranked in the top ten of the last 150 years for heat.

Don't bother them with the facts.
 
Name calling now?

It would appear you are realizing your own demise per this subject of global warming...er, cooling..., er climate change....

You stated the earth had cooled recently due to low sunspot activity. You/Chris also remarked the sunspot activity was at its lowest in 80 years - but 80 years ago, the earth was in a warming trend.

Just trying to follow your path of logic - or lack thereof.

Get real. We are far warmer than we were in the '30s. And we are at a solar minimum, and had a La nina. Yet most of the last four years have ranked in the top ten of the last 150 years for heat.

Simply not true - at least utilizing the US temp records, which are the most accurate due to numbers of stations. You are aware of the data infill that takes place with the historical global temp data, yes?

I suggest you educate yourself far more on this subject - you persist in spouting long-dismissed falsities as fact and your reputation continues to be the worse for it...

Here is some Greenland data: (since the global warmers are so concerned with Greenland's ice melting and causing the seas to rise)

Atlantic+Multidecadal+Oscillation.gif


The 1930s and 1940s were warmer than present time - considerably so.

Same goes for the Arctic:

Arctic+temperatures+since+1900.jpg


Now let us turn to the United States temp. data specifically. This data was quietly revised after faults had been discovered in its tabulations - faults that incorrectly placed 1998 as the warmest recorded year in the US records. You see, it is far more difficult to infill temp data with the US records as there remains an abundance of surface temp station data for over 100 years. (though such infill and trending takes place - most recently by NOAA which showed significant discrepancies when compared to NASA data) Just like the more recent and accurate satellite temp data from 1979 to present is far more difficult to manipulate - data that shows we are hardly warmer now than 1979 when the earth was coming out of a cold spell.

6 of the top 10 warmest years of US temps were prior to 1960. Four of the top 10 were in the 1930s - twice as much as any other decade.

These facts are shown clearly in the following graph, which does not even account for the cooling of the most recent decade - here we see that 1998 - the oft repeated high point of the global warmers, was far less warm than many periods prior to 1950:

hammer-graph-5-us-temps.jpg


And when adding the most recent yearly temp data, we now see the clearly downward trend...

6a010536b58035970c01156ff0861d970c-800wi


Global temps are in decline as well...

global-temp-2003-2008.jpg


trend-of-60-month-slopes1.jpg


VOOROTRENDS.jpg


And the all-important and far more accurate satellite data...

uah_jun09.png


These are the facts pard.

Man-Made Global Warming is a lie...
 
Looks like we may have an El Nino coming up shortly. If it exceeds 2005 and 1998, your hypothesis will have been falsified. In fact, I am willing to bet that in the next 5 years, we will see at least two years that exceed the warmest years yet on record.
 
Geez, Sinatra, you are proving what an idiot you truly are. Run a line across the top temps of the satellite data, what is the slope of the line? Now run one across the bottoms temps of the satellite data. What is the slope of the line?

As for your other charts, until I see the source of each, something a bit better than Kellercitylimits.com, I will regard them as gigo.
 

Forum List

Back
Top