Giss at .77c for September!

Don't forget the post I put up already from WUWT, that shows that the data from the past is altered to make the now look warm. Ain't it fun?

The last post I saw of such data actually showed that data from the very early 1900s had been made warmer and as you moved closer to the present day, the adjustments got less and less. The average of corrections for the last several decades was zero.


I would be interested in seeing that post. I have been following the upward drift of the global datasets for the last few years and I cannot see how your comment can be true. The only way the corrections can balance each other is if the pre-1960 cooling is matched against the post-1960 warming, and that is certainly not trend neutral.
 
It must be true. It came from Billy Bob...

NCDC_Adjustments_to_Seasonality_2008_vs_Sept14.png


You see we are in a sinodal pattern and just as it should we are cooling and will continue to cool for some time. The Peak, which alarmists have been touting as "unprecedented" is simply bull shit as it has happened before millions of times. If you simply take the patterns out to their logical ends you will find the cyclical earth in all of its controlled glory.

The historical plot, as above, takes all those papers the warmist tout and throws them in the round file. All of their screams about CO2 are laid waste as lies. Yet they want to deprive millions of rights and the ability to feed and care for themselves to institute a command and control Communists style government.. under the guise of saving the planet..

Only Fools still believe the garbage of these marxist/socialist/communists pieces of trash.
 
To which I replied:

Your graph states that it is 2008 minus 2014. The graph is negative throughout with a minimum at approximately 1900. The negative value means that the 2008 was LESS than 2014. That would mean that adjustments RAISED temperatures in the past - by the greatest amount in about 1900 and by zero in more contemporary times. This is precisely the opposite of the charge you and yours have been making all along.

Funny, that. Will that error cause you to rethink your infantile charge that NOAA is filled with Marxist/socialist/communists? I'm betting it won't.
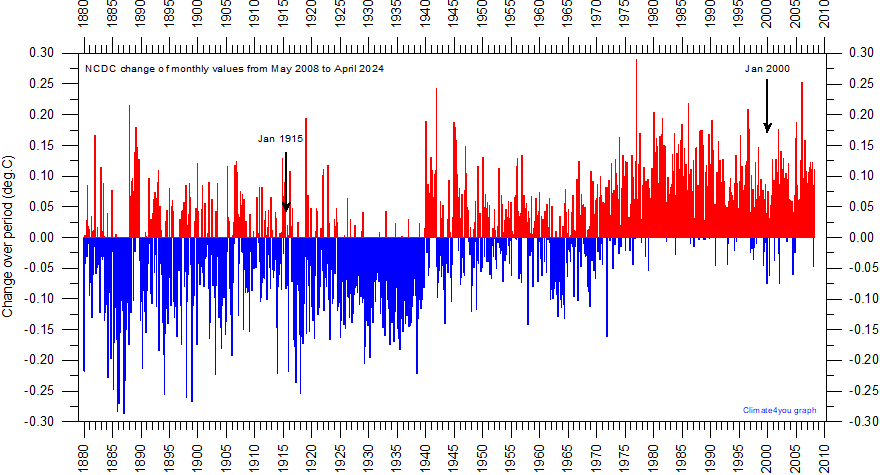


I looked for the provenance of that graph but couldnt find it. it appears to be someone's homemade work up from real data but the title is mistaken (and misspelled ).

here is another similar graph-

NCDC%20MaturityDiagramSince20080517.gif


Maturity diagram showing net change since 17 May 2008 in the global monthly surface air temperature record prepared by theNational Climatic Data Center (NCDC), USA. The net result of the adjustments made are becoming substantial, and adjustments since May 2006 occasionally exceeds 0.1oC. Before 1945 global temperatures are generally changed toward lower values, and toward higher values after 1945, resulting in a more pronounced 20th century warming (about 0.15oC) compared to the NCDC temperature record published in May 2008.

in six years they have added 0.15C to the trend. what does that work out to? about 2 full degrees per century in adjustments! of course it may be foolish to use a linear extrapolation because the only thing that has been accelerating over the last decade is the amount adjustments! hahahahaha

archived 2008 data. http://www.climate4you.com/Text/20080517 monthly_land_and_ocean_90S_90N_df_1901-2000mean_dat.txt
 
Hahahahahaaaa. NCDC has explained the reasoning behind the adjustments they have made. You, on the other hand, have presented zero evidence to support a charge of fraud beyond the fact that you don't like the results.
 
Hahahahahaaaa. NCDC has explained the reasoning behind the adjustments they have made. You, on the other hand, have presented zero evidence to support a charge of fraud beyond the fact that you don't like the results.


the reasons for, and the definitions of, their methodologies do not match the results that come out of the computer black box. eg. after the Texas fiasco last summer many stations and areas were examined and the TOB adjustment was found to be much larger than the stated average in most cases. when queried, the govt agency said it would present a full explanation but so far not even a preliminary report has been issued. if the past is any indication, then the only response will be "check the webpage for an explanation of the methodology", after many months have gone by.
 
Hahahahahaaaa. NCDC has explained the reasoning behind the adjustments they have made. You, on the other hand, have presented zero evidence to support a charge of fraud beyond the fact that you don't like the results.

the reasons for, and the definitions of, their methodologies do not match the results that come out of the computer black box. eg. after the Texas fiasco last summer many stations and areas were examined and the TOB adjustment was found to be much larger than the stated average in most cases.

What happened in one county in Texas is not evidence of intent to make unjustified changes to the entire dataset nor to defraud the American public. For instance, such errors did not take place in neighboring counties. The error was isolated, not systematic. It does not support the charge you and your fellow deniers are attempting to make with it.

when queried, the govt agency said it would present a full explanation but so far not even a preliminary report has been issued. if the past is any indication, then the only response will be "check the webpage for an explanation of the methodology", after many months have gone by.

If the promised explanation is provided on a public website, precisely of what misdeed do you anticipate that they will be guilty?

And, just to be clear, neither is your anticipation evidence of diddly-squat.
 
The Luling TX station had a bad data cable. Global conspiracy!

Luling Update NOT A LOT OF PEOPLE KNOW THAT
---
mesoman
June 27, 2014 7:39 pm
The station I compared it to is mine. I live 5 miles away from the Luling COOP site, and have a Davis Vantage Pro2 with aspirated radiation shield, located in the middle of a large (maintained) grass field. I verify the Davis system every 6 months against a calibrated lab thermometer. I was suspicious when daytime temperatures in sunny, breezy, well-mixed conditions were sometimes 8-12 degrees cooler at the COOP site, which didn’t make meteorological sense.

When I went to investigate the Luling MMTS, my control thermometer inserted into the shelter showed an average MMTS error of -3.6 F degrees over the 30 minute comparison, with larger individual sample differences. I traced the problem to damaged cabling that was causing the temperature readout system to calculate temperatures incorrectly. After the cable was replaced, the MMTS showed an average error of -0.4 F, which is within tolerance.
---

So, the software worked exactly as designed. It quarantined obviously bad data, preventing it from contaminating the average.

There's also a lot of denier conspiracy babble about Texas in general, but it doesn't make any sense, and it's not backed up with any evidence. They just all say it must be a conspiracy, because the rest of the denier crowd says so, and none of them want to contradict the herd. It's tough for the government to respond to that, so don't expect an explanation. After all, it's best not to humor the conspiracy crowd, since that just encourages them. Any explanation is immediately auto-classified as part of the conspiracy, so why bother?
 
here was one situation where an explanation was asked for, and GISS replied that they would respond, but after several follow up emails they never did.

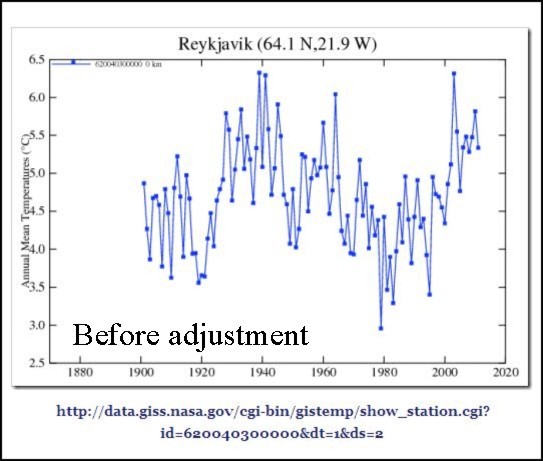
iceland-temp-before.jpg


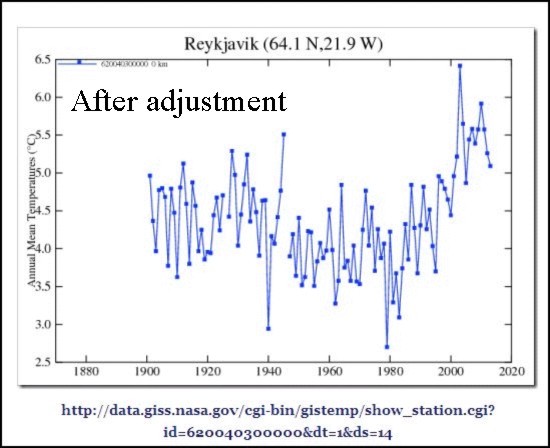
iceland-temp-after.jpg


an official at the Iceland Met said he couldnt understand the change as his agency had made all adjustments necessary as was documented.

today's graph-

station.gif


I see they lopped off another quarter of a degree off 1900-1920
 
There you have it. A massive global conspiracy. The world is NOT getting warmer.

Well, at least not in Cullen County, Texas or Reykjavik, Iceland.
 
Last edited:
There you have it. A massive global conspiracy. The world is NOT getting warmer.


that's the best you can come up with?

why didnt GISS just carefully explain what they had done and the specific reasons for it? are you not even curious? the1965 precipitous drop in the first graph coincided with what the Icelanders call ed the ice years. crops and ocean transport were impacted. those historically recorded events are no longer evident in the record.
 
First, I presume that NOAA, NCDC and GISS are not conspiring to falsify data in an attempt to make global warming look worse than it is.

Second, thousands of sites have had temperature readings from that era (1900-1940) adjusted upwards. Such adjustments have been clearly explained and I have seen no indication that actual climate scientists have the slightest concern that such adjustments weren't justified. Thus it does not surprise me to see similar adjustments, in that time period and in that direction, made to other records.

Third, in dealing with millions and millions of data records, mistakes clerical, technical and technological are unavoidable. You saw that the issue in Cullen County, Tx was clearly - and completely innocently - explained. I see no reason - no reason AT ALL - to make intentional malfeasance my first hypothesis.

Fourth, the historical record already showed exceptional warming in the latter half of the 20th century. The scale of these adjustments is not such that it's going to change anyone's mind as to the reality of contemporary global warming; that would allow a case to be made that couldn't be made before. The motivation you have to assume for the contention you're attempting to make is woefully inadequate to justify lying to the public and to a large population of scientists who have been using these data heavily could not be easily fooled or satisfied without fully sufficient explanation.
 
Last edited:
Second, thousands of sites have had temperature readings from that era (1900-1940) adjusted upwards. Such adjustments have been clearly explained and I have seen no indication that actual climate scientists have the slightest concern that such adjustments weren't justified. Thus it does not surprise me to see similar adjustments, in that time period and in that direction, made to other records.

.
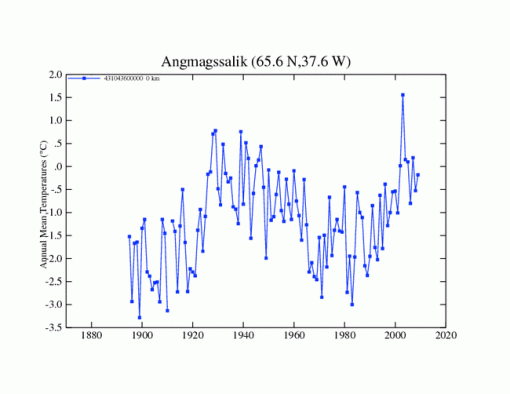
I have no doubt that at least a few stations have had the 1900-1940 portion of their record revised upwards instead of the far more usual downwards adjustment. so find me three of them. post an earlier version and then the newer revised version with a warmer 1900-1940 segment.

eg.-

2010 vesion

ang.gif


today's version

station.gif


there has been a large cooling adjustment made to the early 1900's, as you can see. find us some some warming adjustments out of the 'thousands' that you claim exist.
 
Third, in dealing with millions and millions of data records, mistakes clerical, technical and technological are unavoidable. You saw that the issue in Cullen County, Tx was clearly - and completely innocently - explained. I see no reason - no reason AT ALL - to make intentional malfeasance my first hypothesis.

.

actually the Luliing Texas thing was never properly cleared up. we are still waiting for the official explanation.

I do remember either Nick or Zeke chiming in with the BEST explanation. apparently the GPS coordinates were updated and the BEST algorithm decided there had been a station move and added a degree at that point, even though there was no elevation change and the two GPS locations were less than a hundred meters apart (and no actual station move had occurred).

you don't seem to realize that mistakes made by unattended black box algorithms are mistakes and need to be investigated.

as a kid I had a few physics labs returned with raised eyebrows when my results just happened to have mistakes that fortuitously added up to the right answer. I cannot remember if there was any actual deceit involved but I do know that expected results are scrutinized less than unwanted ones.
 
Second, thousands of sites have had temperature readings from that era (1900-1940) adjusted upwards. Such adjustments have been clearly explained and I have seen no indication that actual climate scientists have the slightest concern that such adjustments weren't justified. Thus it does not surprise me to see similar adjustments, in that time period and in that direction, made to other records.

.

I have no doubt that at least a few stations have had the 1900-1940 portion of their record revised upwards instead of the far more usual downwards adjustment. so find me three of them. post an earlier version and then the newer revised version with a warmer 1900-1940 segment.

eg.-

2010 vesion

ang.gif


today's version

station.gif


there has been a large cooling adjustment made to the early 1900's, as you can see. find us some some warming adjustments out of the 'thousands' that you claim exist.


here is the GISS graph compiler. the actual links seem to break after a day or two.

Data.GISS GISS Surface Temperature Analysis

try it out for yourself. google a historical version for any station, and then go to GISS to see the most recent version. occasionally I have found some stations with no or little change but in the vast majority of cases the trend has been increased by lowering past temps, increasing recent temps, or both.
 
I don't see a point there, either.

All of these conspiracy theories seem to be a kind of inverted Occam's Razor; whereby we take the least likely scenario, and assume it to be true until someone proves otherwise. The question being why anyone would devote any serious time to disproving something probably no one really believes to begin with.
 
what conspiracy theory?

I am pointing out, using data from official agencies, that the historical temperature record is changing constantly, and in most cases to increase the trend. the trend just from adjustments is more than a whole degree celcius per century, as much as the total increase for the last century. is today's data right? last year's? 2005's? will next year's data be the 'right data' and supercede today's?

the methodology declared on the websites of these governmental agencies does not match the adjustments made to individual stations. when questions are asked no specific explanations are given.
 

Forum List

Back
Top